The Socially & Politically Inconvenient Truth About Race and IQ
If anyone is into editing for grammar, go ahead and highlight the errors, I did not edit anything for grammar and just typed this up in the medium website so there were no prompts of grammar errors.
“No doubt, real racists will seize upon a genetic component in the racial IQ gap as a defense of their position. But we know that in fact, it does not provide the classical racist with any defense at all. Better to confront them with the truth rather than a fiction, and whatever the rhetorical disadvantage, forfeiting the benefits of knowledge over ignorance is too heavy a price to pay” — James Flynn, 2017
The big bang was never proven with a test tube, nor should it have to be. Science moves in terms of what is the most parsimonious explanation for where the converging lines of evidence point. There is this weird misunderstanding that woke people have — they perceive this topic like a criminal trial… we are not trying to convict black people for genetic differences in mental ability. We are simply examining the existing data and seeing where the evidence points as the most probable explanation. It is quite literally impossible to rule out “unknown” causes of between group differences. In the case of a baking soda and vinegar volcano, there is no way to disprove the hypothesis that “confounding variables” cause the difference since chemistry is theoretical itself. When somebody posits that “nobody knows” why these gaps persist, they are deviating from the scientific tradition of providing the most probabilistic explanation.
There is no empirical or theoretical evidence on the planet that supports the equalitarian view, it is contingent on moralistic fallacies, dangerous thoughts triggers, and happy thoughts leniency (Rushton & Jensen, 2005; Gottfredson, 2009).
To put matters bluntly, race differences in urine chemistry are, to an extent, caused by the same underlying mechanisms as the differences in blood pressure that persist in net of whatever variables you control for (Bankir et al., 2007) and yes, it is because of genetics to at least some extent (Hoh et al., 2019). These sorts of systemic biochemical and physiological differences exist in every bodily system, they have real world implications, and we do not hide from them — why do this about the brain?
Twin Studies are Valid
I have not encountered many people who reject the race realist view that believe in the validity of twin studies, so I may as well defend them first and foremost. Arguments against twin studies are typically founded more on theoretical concerns than based on the empirical findings.
One concern is that there is selection bias. One form could be that since having twins is not independent from genetics (having twins runs in families), you could have a restricted range of genotypes. This is a good point, and warrants further investigation. The method to get around this is by using kinship coefficients.

For twins, they calculate (Rdz-Rmz)*2+Correction for assortative mating. The reason for this is the kinship between MZ twins is 1.0 which is twice as much as DZ twins. A modified formula of [R(Siblings Raised Apart)-R(Cousins Raised Apart)]*4, can be used to test this assumption. (0.25–0.15)*4= 0.40; this is pretty close to the estimate from the twin studies which shows a 0.50 (both of these do not correct for assortative mating), and the reason that the cousins raised apart may not be as similar is that they are less genetically related so their somatic mutations, epistasis, and even methylation (a very trivial share of the variation) are going to be different.
Another concern is that there are certain types of people that are more willing to sign up for them (affluent whites), so you might get a restricted range of environments. I would intuitively think that conservatives would be more hesitant to do this sort of thing, but I am pretty sure that liberals are anti-genetics now. The same can be said of adopted MZ twins raised apart — adopting parents tend to be affluent and Christian. This does not seem to be a major concern in practice, but is a good point on a theoretical basis. Studies that use large data sets that are not self selected and use siblings still find the heritability of mental ability or academic achievement on standardized tests (moderate proxy for IQ) to be 40%–60% in teenage years; this does not mean that the heritability is 40%–60% across the entire lifespan (Figglio et al., 2017; Benyamin et al., 2005; Sundet et al., 1988).
Using data from misclassified twins, researchers can check the equal environments assumption and if it is valid. It seems to be a valid assumption (Conley et al., 2013). Sandra Scarr defended twin studies on this grounds as well (Scarr & Carter-Saltzman, 1979).
The degree to which violations actually impact heritability estimates is trivial at most — “Heredity, Environment and Personality: A Study of 850 Sets of Twins” by John C. Loehlin (1976), explored 850 twin studies and found no impacts of these peculiar critiques. Having the twins dress the same, if they were in the same class at school, etc. that oddballs on the left may point to are not meaningful.
Rejection of twin studies on the basis of GxE is immature. There are developmental experts with strong opinions about GxE, but rarely is their interpretation of GxE “heritability doesn’t mean anything.” Gene x Environment studies are at risk of extensive publication bias and low statistical power (Duncan & Keller, 2011). Read my thing about the misleading use of odds ratios — it is terrible. New stuff in that field and indirect replications are not reliable, I also have an entire section on the interactions.
The prenatal environment is kind of weird to me in a sense that most of these things are either (1) Heritable behaviors like drug use or alcoholism. (2) Heritable biochemical processes. (3) Between race differences like iron and vitamin D that are due to more systemic biochemical and physiological differences (will expand later).
Some argue that sharing a placenta in the womb may inflate similarity. This is likely to be untrue, however, it does make sense on a theoretical level. While it has been found from correlational data in one instance that MZ twins that share a placenta were more similar and the may could explain 10–14% of the similarity (Jacobs et al., 2001), other instances have been less successful.
“Larger within-pair similarity in 7-year-old MCMZs than in DCMZs were reported for IQ scores assessed by the WISC (Melnick et al. 1978), and for block design (WAIS) in adults (Rose et al. 1981) and in 10 years old twins (Spitz et al. 1996). Three years later, these authors could not replicate this finding in the same set of twin pairs, but reported larger within-pair differences for DCMZs for the Perceptive Organisation Index of the WISC-III (Gutknecht et al. 1999).” — Van Beijsterveldt et al., 2015
Larger within pair differences are cool, but it is a post hoc observation. Maybe, that finding should be replicated before anyone starts parroting that claim like these negligent boomers do in that paper.
Lastly, twin studies are actually biased against the genetic explanation of human traits. Identical twins are not entirely identical (Liu et al., 2017), and this is one of the assumptions. I am unsure as to how much of the non-genetic variance in intelligence between MZ twins is due to genetic differences between MZ twins, probably not a meaningful amount.
When interpreting a high heritability estimate, it is best to interpret it as “low present environmental variation” instead of “x is genetic.” For example, the heritability of obesity is high, and this means that we all have more or less the same access to food and exercise. That is why people who are “finding the genes” about obesity are looking in the brain (eg Vainik et al., 2018).

And no, variance components are not independent (Turkheimer, 1990).
The Interactions Stuff is Not So Hot
One twin study that had a sample size of 112 (kind of small) estimated gene-environment interactions to explain about 9% of the variance in intelligence (van Leeuwen et al., 2008). Even though that is not a lot… 9%? Nah, I don’t buy it.
There is a persistent publication bias that makes a lot of this stuff look like it is something, when it really is not. Activist researchers at Duke have made grandiose claims about GxE stuff that turns out to be hollow.
A gene-Environment interaction for breast milk and IQ has been suggested in the past (Caspi et al., 2007). A decade later, it seems that it was put to rest as a negative, but some may say that it is the real deal(Pires Hartwig et al., 2017).
There was some other stuff from about depression and adverse experiences (Moffit & Caspi, 2006). That stuff on is done as well. There is no reason to believe in it (Culverhouse et al., 2017).
“Regarding future cGXE studies, perhaps the most important point to keep in mind is that, as argued earlier, the first decade of cGXE research has produced few, if any, reliable results. That conclusion, which has been increasingly recognized in the psychiatric genetics community, explains the growing divide between the genetic studies most frequently referenced by psychological scientists and those most frequently referenced by psychiatric geneticists” — Duncan et al., 2014
And below is a graph from a review below, (Duncan & Keller, 2011) that shows the highly probability that these G x E effects are simply not what we were promised.

Existing G x E stuff with specific genes is pleiotropic and should not be held in higher esteem than GWAS.
“Given the complexity of individual differences in intelligence, it is plausible that many DNA markers with G×E effects might be epistatic markers or epigenetic markers.” — (Sauce & Matzel, 2018)

Reciprocal standards of evidence are part of ethical discourse, the people who believe in the environmental explanations either are dumb or do not engage in good faith. Many people reject GWAS (understandably) as a test of race differences due to the pleiotropic nature of GWAS. These GxE studies that use SES or an adverse experience are also subject to this scrutiny as well.
HxE Interaction: Revisiting the Evidence
It has been hypothesized that perhaps low SES = lower heritability. This seems sort of suspect on its face, but it is intelligible. The reason that it is an intelligible hypothesis H²=Genetic Variation/Phenotypic Variation. The belief that there is more variability at a lower SES than a higher SES due to diminishing marginal returns or an upper limit on environmental quality is reasonable (think about the gummy bear vitamins and how eating 5 of them is not going to help you any more than one or two).
One problem on the theoretical level is that we do not know if a Scarr-Rowe effect is artificially depressing some IQ’s or artificially raising some. Another issue is that a poor kid in the 2010’s and beyond has a better environment than an affluent kid 50 years, so you are really making a bold assertion — that is that everything from before 1970 on the heritability of intelligence was wrong. It still is possible, maybe Cyil Burt was just an evil racist.
Tucker-Drob and Bates, 2015
The meta analysis that everyone and their mother has seen that includes this graph has some interesting stuff to it that needs to be addressed. There is also the elephant in the room which is — they found no evidence outside of America and there are black people in Europe.
Turkheimer et al., 2003 is an outlier that failed replication several times. It is cited over 1,000 times and is a premise for many US policies today! The effect was in 7 year olds which is a concern as well, the heritability of mental ability at that age is low to begin with — only about 30%.
Rowe et al., 1999 used an abridged version of the PPVT which is not an IQ test and should not be used as a proxy. The full version correlates with IQ scores at about 0.45 so there is going to need to be a massive sample (several thousand) for it to be able to tell an HxE. Moreover, it is often not a reliable instrument when it is unabridged and used in adolescents — split half reliabilities often fall short of 0.70. Nobody knows how the abridged versions correlate to IQ, but one would assume fewer questions=weaker proxy for mental ability. The paper is kind of useless in that sense.
“Correlations of the PPVT-R with other intelligence composites typically range from .40 to .60 (Dunn & Dunn, 1986; Kaufman & Kaufman, 1983c; McCallum, 1985). These modest concurrent validity estimates suggest limited shared variance. Therefore, the PPVT-R should not be interpreted as equivalent to intelligence test scores.” — Elsevier
There is a second study with the PPVT in there that used it in adults. The PPVT is known to overestimate low intelligence in adults and underestimate high intelligence in adults (Elsevier). This measurement error that is stratified by IQ is going to be problematic because there is some degree of collinearity between childhood SES and IQ — it is known to be about .20 to .40 in most cases. This certainly does not mean that there are not poor kids that are smart, but a modest correlation can have meaningful effects.
The data is from the NLAHS (National Longitudinal Adolescent Health Survey) and it is not good. The 2nd go around is unpublished for a reason. I assume that an abridged PPVT was also used in the second go around if it was the first time, but the authors of the meta analysis do not even specify what PPVT version was used in either case. Moreover, the attrition is a considerable, but no a deal breaker. Nearly 700 of the initial 1909 pairs dropped out of that cohort. The dealbreaker to me is that the heritability of PPVT scores DECREASED from 0.71 to 0.67 in this time period which signals flawed data to me. The heritability of IQ goes up with age — whatever sort of thing is being tapped into by these tests is simply not g. This matches the elsevier description of low shared variance.
I would like to also note that the Turkheimer, 2003 paper reported SES by percentile, and now they use a standardized SES. I assume that this is because it pushes the middle together and you can make the slope appear steeper than it is.

The results of the 2015 meta analysis suggest that either there is a tremendous amount of bias in the American studies or there is a unique aspect of America that causes SES and heritability of IQ to be related.
Tucker-Drob and Bates did this separation by country in a post-hoc fashion. Normally, studies are pre-registered to prevent what is called sample splitting (and other things). Here is a professor’s tweet that explains what sample splitting is.
Revisiting their data, there are a lot of problems. This was not all IQ stuff. Their data provides evidence against their conclusion.
- Looking at the studies that took factors of abilities alone
- Ignoring the studies on babies because babies have near zero heritability (formidable evidence of a Scarr-Rowe Effect in childhood exists — nothing wrong with conceding that)

A reanalysis of Tucker-Drob & Bates excluding the stuff with babies and the ones that did not use broad factors or composites yields no significant effect in America — even when I include Turkheimer, 2003 (which should be excluded).


When the filter for the broad factor/composite is removed, but the filter against the tests done on babies is kept and the PPV is added to the exclusions (the filter for studies that took a general factor or a composite excluded it from the previous trim and fill analysis) — it is not statistically significantly different from zero.

This study also excluded a lot of evidence that is contrary to the claims being made. Because of this, a replication attempt was done for achievement — there was not evidence in the diverse state of Florida (Figglio et al., 2017).
The Heritability is the Same Across Races
Similar to the Scarr-Rowe hypothesis, some have suggested that the heritability of intelligence is lower in African Americans than in whites. James Flynn implied this in his 1980 book when he said that environment believers should get a good estimate for the within group heritability of IQ in African Americans (if he believed it to be the same or higher, he would not have said this).
Snyderman and Rothman, 1987: 39% of experts felt that there was sufficient evidence to give a white heritability estimate, 20% said that there was enough to give one for African Americans heritability. While this may sound like a big deal, this really means that both of them were unpopular. The average point estimate of 214 experts on the white heritability was 59.6%. Of the 101 that gave an estimate for the African American heritability, the point estimate was 57.1%. It is fair enough to believe that since the majority did not believe that either group estimate was ready to be given, we may want a more recent opinion. A more recent meta analysis showed that the heritability is the same across races:
“At least in the United States, Race/ Ethnicity × Heritability interactions likely do not exist.” (Pesta et al., 2020).
The burden of proof is not on the race realists for this matter. Pesta et al., found a heritability of about 60%, however, these were not adults so the Wilson Effect will increase it further. I do not give an inch from the number 80% and no race realist should because it has meaningful quantitative implications in a lot of the stuff that I am not talking about here.
Heritability in Africa
The heritability in Africa is the best way to get a proxy for extreme poverty’s impact on heritability. Here is the evidence:
Population: Heritability: Citation
10 year olds in Sudan: 17.2%: Toto et al., 2019
14/15 year olds in Sub Saharan Africa: 30%-40%: Hur & Bates, 2019
It is worth noting that one of the authors of the meta analysis that people cite went on to show that the H² in Africa is higher than what many progressives estimate the H² is at low SES in America.
Should the Scarr-Rowe hypothesis be proven accurate, this doesn’t prove anything except race differences exist! Take the three common views of equalitarians:
- Wealthier places have a higher heritability.
- All races were equally selected for intelligence.
- White countries developed before many others (fact).
The conclusion is still race differences.
Polygenic Evidence of Scarr-Rowe Effect is Bad Evidence
It is disheartening to see somebody ostensibly based like Robert Plomin fall for this. In a study he participated in (von Stumm et al., 2019), they look at the predictive validity of a polygenic score at extreme ends of SES. The problem with this is that epistatic effects are more prominent at the extreme ends of traits. Socioeconomic achievement — in this case I am using income as the best proxy — has been known to be characterized by epistatic effects for a very long time because the rMZ>2rDZ in twin studies (Hyytinen et al., 2013). Epistatic effects can reshuffle intergenerationally, but there is still assortative mating for things that cause MASSIVE epistatic effects in educational attainment such as autistic traits (Richards et al., 2013*). There is a huge difference between using polygenic scores to look for differences in means vs. extremes.
In conclusion, the answer is no. Polygenic evidence of a Scarr-Rowe Effect is not good evidence and should not be treated as good because it makes people happy.
*There is a study that has since been retracted that is cited in that paper. The study that was retracted is about how widespread autism is. It really does not matter how many or few cases of autism there are, the results of the paper are not contingent on the frequency of the phenotype.
X-Factors are Near Mathematically Impossible
While it has been argued that there is a way for there be high within group and low between group heritability, this is often described with this image
Americans DO NOT live in two separate pots. We live in one society. Racism is not really a direct cause. Racism is a constructed idea. Racism itself may cause poverty, low self esteem, physical pain, etc. which are all non-unique environmental influences. To ignore this fact is dumb.
Excerpt from Russell Warne’s book: “In the Know: Debunking 35 Myths about Human Intelligence”
“Theoretically, it is possible that there is an X-factor operating exclusively on members of a racial group — it just has not been discovered yet. This is highly unlikely, based on the results of tests of measurement invariance. Recall from Chapter 28 that measurement invariance occurs when a confirmatory factor analysis performed on data from two separate groups produces the same results. Research has shown that intelligence tests demonstrate measurement invariance across racial groups. This has an important implication for X-factors because it is mathematically impossible for measurement invariance to occur and for X-factors to be present. This is because an X-factor must alter the relationship among test scores for the group experiencing the X-factor, which would result in a failure of measurement invariance (Dalliard, 2014; Lubke, Dolan, Kelderman, & Mellenbergh, 2003). This is extremely strong evidence that there are no X-factors operating uniquely on a single racial group”
For an x-factor to exist, it would have to only be present in one group and impact all of the subtests the exact way the g factor does. This is incredibly unlikely, given that we have not found ANY environmental variable that can do this. I find it unlikely. Regardless, the burden of proof is on individuals that posit the existence of x-factors. Warne says that it is impossible for X factors to exist in the presence of measurement invariance, I have been told that it is theoretically possible (though given the evidence of no environmental influence with a g-loading of effects equivalent to 1.0, it is functionally impossible).
Measurement invariance is tested using a multi-group confirmatory factor analysis. A multi-group confirmatory factor analysis tests if the underlying common factor of variance being measured is the same in each population.

A common factor is detected using an exploratory factor analysis. It looks at a bunch of correlated items and then tries to find the shared variance. Multigroup confirmatory factor analysis makes sure that the same latent variable exists in each subpopulation. Measurement invariance between races has been established — a more recent citation than Warne provided is (Frisby & Beaujean, 2015).
Between Group Heritability
Within group heritability and between group heritability are algebraically related given a few assumptions such as the same heritability in each group and no unique environmental influences — which have been shown.

The equation that is derived from this figure will be

A different method used by Jensen was the equation

Some of the assumptions are the there is no assortative mating for intelligence in biracial individuals and many others. It is very dubious method that can be adjusted.
Sandra Scarr used this formula in 1977

Depending on what method of calculating the between group heritability you use, you can get different results that typically fall between 0.5 and 0.8. Some methods will give a lot more or less.

The rising constraints of heritability can be outlined on a table as shown below.

The heritability of IQ tends to be estimated around .5 -.8 and there are people who say .40, but those are really outdated estimates that are from 10–14 year olds normally. In Russell Warne’s book, he uses a heritability of 0.5 and assumes that the black-white environmental gap is d = 0.658 (Warne, 2019b) (It is an unpublished manuscript, you can ask me for the data), which is far short of the threshold for between group heritability to be 0. In Sesardic’s Making Sense of Heritability, he comes to a similar conclusion. “Missing heritability” is not the monster in the closet that many people believe it to be. In fact, the missing heritability is likely to pile onto the existing group differences.
Stereotype Threat is Dubious at Best
The question of WHO’S STEREOTYPE’S? is a question that matters. It seems that whites are the least likely to actually believe these things based on the General Social Survey data, and the ones that do tend to be low IQ.
This is a super politically convenient explanation for genetic differences, but unlikely to be true. Basically, it means the people think that racism makes them actually believe that their IQ’s are lower and then they do bad, so if you stopped being so racist, maybe you wouldn’t have these score differences. Unfortunately, it seems to be to be fake, In China, Chu et al., 2018, disproved it there. Emil OW Kirkegaard also found a black-white one being hidden, they have really bad replication rates, here is a misinterpreted meta analysis on stereotype threat and immigration, and Shewach et al., 2019 found that the effect size of stereotype threat is trivial in high stakes testing.

Causal Pathways of Stereotype Threat
The reason that these causal pathways matter is that I am not going to be convinced by studies that show this. I think that for the most part it is kind of a goofy woke liberal thing on the theoretical level (by liberal, I mean culturally; topics such as economics are ones that I have not thought much about myself).
(1) Self Image: The first causal pathway that stereotypes may impact IQ scores is that it could reduce one’s self image. If you have a low self image, maybe it will make you do worse. Sure, if people were to give you the impression that you are just worthless, stupid, and uncivil because of your skin — maybe you would do worse. Let us find out.
African Americans have the highest self esteem of any demographic (Bachman et al., 2011). This seems counter intuitive, given that there is the highest level of conspicuous consumption amongst African Americans (Charles et al., 2007) and reasonable explanation is that this a coping behavior where they are projecting insecurities about money, but it seems that they are just not an insecure peoples.
A 2012 study explored how people feel about their own intelligence using a sample of over 2000 college students.

Race differences were also explored in this study.

Given the lack of a meaningful gap between African Americans and Asian Americans, self estimated intelligence should be dismissed as a possibility of causing the IQ scores. Moreover — in a country like Mexico, Mexicans do not face stereotypes, but they come here and their IQ scores do not seem to change much. In other words, new stereotypes being introduced does not lower IQ.
(2) Mindset: The second causal pathway that stereotypes may effect somebody’s intelligence is that it could harm their MINDSET. This is distinct from the self image because the mindset is something that is said to impact school performance and how much is learned. If you learn more stuff, there are parts of an IQ test that this may help you on. For example, the ability to do the analogies on an IQ test is moderated by initial vocabulary. Perhaps if you have a better mindset, you could learn more in school and your vocabulary will be better. The vocabulary section is very g-loaded, so maybe this explains some of the gap and could even refute some of the correlation between the g-loadings and the size of the gaps.
The answer is no, this is one of those things that gives me a visceral disgust because it is so woke and sort of feels like 10 year olds made it up.
The evidence suggests that the “mindset revolution” might not be the best avenue to reshape our education system. — Sisk et al., 2018

(3) Cognitive Load: A pretty difficult hypothesis to falsify is that there is an increased cognitive load. I have never seen positive evidence for it, but hey, who knows. To me, it seems like this would not have an impact because they will intuitively conclude that it is because of socioeconomics and oppression.
(4) Ethnic Identification: The degree to which somebody identifies with their ethnicity is a hypothesized moderator (ie McFarland et al., 2003), BUT ethnocentrism negatively correlates with intelligence. The fact that somebody “disidentifies” with a race is a weird thing that is too abstract to measure objectively and should be ignored. The reason that measures of in-group/out group preference is not going to be assessed with heat thermometers for this is because it is objective.
The proper method of controlling for this would be to compare the ethnocentric people that are exposed to stereotypes with the ethnocentric people that are not exposed. Comparing the ethnocentric ones to the general is a flawed method. If you told people that you like burgers and told another group that you do not, comparing the ethnocentric people in one group to the totality of the other will suggest that telling people a certain thing about burgers will change their IQ test performance.
(5) Stereotypes Make People Lazy: It has also been hypothesized that effort causes differences (ie Thomas Sowell); but the problem is, effort does not mean a whole lot. Maybe stereotypes force the effort to change? The evidence is sketchy. In determining life outcomes, grit — I think that means resilience and work ethic sort of stuff (Zissman & Ganzach, 2020) explains pretty much none of the variation in life outcomes. If telling people that they were lazy made them bad at tests, it would also have to make them bad at everything else that requires that same skill that the tests are measuring.
Lastly, these stereotypes are not held equally by both genders so how could this even be possible that black women seem to do better? Seems unlikely.

IQ Tests are not Culturally Biased
Many people conflate the culture loadings with cultural bias. Culture loadings are about how much the test changes when translated, but that is a different story. I am worried about America. If you believe that printing tests in English, then “translating” them to African American Vernacular English would raise IQ scores, there is no evidence to suggest this would happen, but I would be thrilled to see it happen (if it actually reduced gaps). The burden of proof is on you to go do this.
“5. Intelligence tests are not culturally biased against American blacks or other native-born, English-speaking peoples in the U.S. Rather, IQ scores predict equally accurately for all such Americans, regardless of race and social class. Individuals who do not understand English well can be given either a nonverbal test or one in their native language.” — Mainstream Science on Intelligence
and
“Considered as predictors of future performance, the tests do not seem to be biased against African Americans.” — Intelligence Knowns and Unknowns
Researchers have done studies where they try to build “culture free tests” that are absurd (Fagan & Holland, 2002; Fagan & Holland, 2007; Fagan, 2008).
In the 2002 paper, the researchers looked at ability to learn words vs. full vocabulary. The problem is that the effect size of the race gap in rote learning ability is about 0.20 standard deviations which is not statistically significantly different from the meta analytic effect. The rare vs. common words gap is likely a gene environment correlation because the gap on IQ tests has been stable despite the expansion of public libraries, the internet, etc.
This leads to the obscure conclusion that IQ tests are biased. This is called a gene-environment correlation. Higher IQ people will be more predisposed to read things on their own time and expand their vocabulary. Memorizing words and repeating them is called rote memorization and that only has a g-loading of about 0.20, so trying to pass this as a highly g-loaded test battery is either ideologically driven blindness, dishonesty, or stupidity. I do not care which of them it is — I do not like any of them.
Spearman’s Hypothesis is Correct


Spearman’s Hypothesis is that there would be a correlation between the g-loadings and group differences. This has been verified in Japanese samples (Kura et al, 2018) and the black-white gaps. This implies that the black-white gap is on g.
There is also a positive correlation between the heritability and g-loadings that has been observed in primates (Woodley et al., 2015; Fernandes et al., 2014) and in non-western nations (te Nijenhius et al., 2014). The interpretation of the te Nijenhius et al., 2014 paper is that the number of subtests was a moderator for the g-loadings and heritability correlation — when a lager number is used — such as Jensen showed in “The g Factor: The Science of Mental Ability,” it is made clear that there is a good correlation (moderate to strong depending on the subtests).
Larger sample sizes also increases the correlation between g loading and heritability. One problem with the graph below is that it shows a logarithmic function and they fitted a linear one — or a log transformation of the X axis would have worked.

The genetic factor loadings and phenotypic factor loadings are highly correlated very well.
“Correlations between phenotypic g loadings and genetic g loadings were 0.88 and 0.76 for the two mental test batteries. — Deary et al., 2006”
To reiterate this, the more pure measures of intelligence show larger group differences, and variation across the population is also more contingent on genes. The heritability of the latent g factor has been estimated to be 0.86 (Panizzon et al., 2014), however, estimates as low as .50 or so are out there too. The group differences on g tend to exceed group differences in IQ scores on any given test (NSLY97; Frisby & Beaujean, 2015; McDaniel et al, 2014).
Evolutionary Biology
There has been acceleration of human evolution in the last 40,000 years (Hawks et al., 2007). The reality of differences between human populations is undeniable, however, the extent to which people vary is a question that generates mixed answers.
Regardless of how different we are, what matters is the ways in which in we differ (Wu & Zhang, 2011).


I think that it is important to recognize the first two traits — pituitary gland development and dorsoventral neural tube patterning. This is, in my view, a complete vindication of the hypothesis that human populations differ in life history strategies, but some might disagree.
The neural tube is a key part of developmental biology. Dorsoventral means where the front and the the back meet basically. It is important, I am not going to explain how early development works and how somites work — if you do not think that this is an important difference, it is fine. This is one of those things where it is a lifecycle trait that should be viewed as strong evidence.

There has been natural selection in all sorts of gene ontologies, including a considerable amount in the neural function, cell cycles, reproductive traits, pathogen response, and protein metabolism (Wang et al., 2005).

Considering that the evolutionary rate of the prefrontal cortical growth has been high for quite some time and been accelerating for a while, it is not reasonable to think that it just stopped. The burden of proof is on the people who believe that this expansion stopped to provide evidence that affirms their view. The default hypothesis is that it would continue.

There is evidence of differences between whites and Asians which are difficult to imagine being non-genetic. Some have hypothesized that it is the language, but an easy way to test this is to see the IQ scores of Asians in America that do not know any non-English languages.
The totality of evidence suggests that the expectation of equality in group averages is unrealistic and not based on any sort of rational arguments. Obviously, this is not the strongest evidence, but it does give a good gauge of the probability of a 0% between group heritability.
Admixed Populations and North-South Gradients
What is Admixed?
If you do not know what the term admixed populations means, it just means mixed ethnicity/race. This is derived from the term “admixture” which is the percentage of your total ancestry that goes back to a specific ancestral population. For example, Mestizo (1/2 European, 1/2 Amerindian) have less European admixture than Castizos (3/4 European, 1/4 Amerindian), but both are admixed populations. Admixed populations tell us a lot. I used the admixture analysis in a previous article talking about genetic risk for Type 2 Diabetes (mainstream), however, this approach is frowned upon in psychology.
Admixed Populations
I would like to start this with a quote from Richard Nisbett, somebody who does not believe in race differences, agreeing that this would be evidence.
“If European genes conferred an advantage, we would expect that the smartest blacks would have substantial European heritage.” — Nisbett, 2007
And he cites evidence from Chicago and blood analysis (poor precision), and the Eyferth Study (because he is a moron).
Eyferth Study
A commonly misrepresented study is the Eyferth study. Here is a link to the original text (in German), and here is the story. After WW2, some US soldiers stayed behind and married German women (traitors). This means that the white men had white kids and the African American men had biracial children.
Unsurprising to many cultural enthusiasts such as Richard Nisbett, James Flynn, and Thomas Sowell, the biracial children raised by military fathers were not far off 100 on average and about the white average was pretty close.
What is crazy is that James Flynn wants failed replications of this study as sufficient evidence to change his mind, even though the study does not support his opinion:
“(6) Is it not legitimate to ask exactly what would convince people like me and Turkheimer that we were wrong? If we are to ask this of others, a prerequisite would be to first answer it ourselves. I have done so by implication (negative results from a series of studies like Eyferth’s but better), but I can imagine data from progressive knowledge of the human genome. Can Turkheimer not imagine evidence that would settle the issue for any fair-minded person? And if not, what a peculiar exception to all the questions posed by the sciences of man.” — James Flynn, 2007
So James Flynn is bad at math, a socialist, and was a forced integrationist back when it was unpopular — I guess he is honest so at least that is cool. He has this weird obsessed with the Eyferth study which does not provide any evidence to support his view. When the results are broken down by gender, they look like this:

Unfortunately, the only thing surprising about these results is the white female IQ being so low. The reason for this is that the pool for fathers is truncated. About 2% of whites and 30% of African Americans were ineligible for the military at the time (Davenport, 1946). The average African American IQ at the time in America was 85 (Murray, 2007), so we can actually do some math and figure out what the true expectation is by finding that midpoint between the mothers estimated IQ of 100 and the fathers estimated IQ based on the mean of a truncated Gaussian as below. What was the IQ score of the black fathers?

The midpoint of 92.45 and 100 is 96.226, so it is not surprising that the biracial kids scored as they did. People who cite this as evidence of an environmental cause are simple unable to do proper mathematics. You do not need to know calculus to do this, there are websites online that can do it for you if you need help with it.
Italians

Southern Italy has North African Admixture and the intellectual achievements in Southern Italy vs. Northern Italy are unimpressive, the heights, IQ scores, GDP, etc. in Southern Italy are lower as well. This is correlated to admixtures of populations (Lynn, 2010). People talk about racism against the Italians, and well, that was sort of because they were significantly lower in IQ… people observed this and did not know how to properly respond to this.


These findings in Italy are persistent:


There also is a gradient of diabetes instances that goes with regional IQ scores. Some that argue against the admixture gradient and say it is a north-south one are not making a new point. I do not particularly care if it is a north-south or admixture gradient, whatever the cause is, these gaps are in accordance with the race realist position.
African Americans
Polygenic scores are actually a really bad method of doing this since they do not control for epistatic effects and such, but it is useful anyways. The reason that they matter is that they are a bar of evidence set by Richard Nisbett — in fact, he says that he would expect it to be a “moderate” predictor… r=0.411 for the polygenic scores. He does not change his views with the evidence, because he is racially motivated.


There are copes such as “admixture reflects how you will be treated by society,” however this has been empirically disproven as a cause for IQ scores. Russell T. Warne has addressed these claims in his book and his review of textbooks. Racism as a cause for IQ gaps is addressed in Dalliard, 2014. It turns out, we can investigate the hypothesis that between group and within group variation have the same causes, and they do.


Even the stereotype of southern whites being less intelligent plays into the hands of the race realist position. Maybe their IQ’s are lower, in part, due to the African ancestry being a good bit more frequent amongst those whites? There are other reasons, but it is just about acknowledging the vastness of this pattern — first black president? Half white. First “black” VP, well, she is mostly Indian. I assume Brahmin.

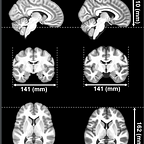
Mixed Brains
The mixed race brain falls somewhere between the black and white brain, on average of course. This is unlikely to be a result of purely environmental factors given that the polygenic scores are what they are.

North South Gradients
Similar to Italy (which is mediated by genetics due to the considerable admixture differences between the north and south), several countries have North-South gradients, though Italy is more unique due to the admixture difference being more noteworthy the in other instances. These are in northern hemisphere nations. You would may see the opposite in some southern hemisphere nations, I have never really looked into that.
In America, if you look at the IQ scores of each state and isolate for the whites, you still see that whites in the north are higher IQ than whites in the south. You can argue all you want about “oh the Hispanics say they are white” and so on, however, the north has ALWAYS been ahead of the south in terms of economics. Higher in IQ points does not mean correct in politics, but ignoring these IQ differences and attributed north south economic gaps to economic policy is silly. If I have a higher IQ than you and tell you that 2+2 is 5, do not believe me. Likewise, if you have a higher IQ than me, I will not listen either.
Japan:
I showed that Spearman’s hypothesis is true in Japan which is strong evidence to believe that the gaps are due to genetics. The correlation between g-loadings and heritability is only about 0.4 in Japan which is not as strong as in Western nations, however, the number of subtests used to get that correlation is fewer than the number we have in western nations. The total correlation from the meta analysis was on .38. When using 6 or 7 subtests, the correlation was .31, but when using 8 or 9 that number became .45. Knowing this, we can assume that the data would probably look a bit more like western numbers if they were to use 10+ subtests.


The Gradient in Spain is a topic of debate, but it does exist:

Lynn assumed that there was large amounts of what he believes to be “dysgenic” race mixing between the Spaniards and the North Africans that colonized (as to if it is dysgenic or not is subject, I refrain from referring to other ethnic groups as inferior). He may be incorrect. If Lynn is incorrect, I would cite the fact that they were Muslims, and it strictly against their religion to mate with non-Muslims. Wehrkatzer disagrees with Lynn and has cited Comas et al., 2000 which explored the possibility and it suggests that there was too significant of a geographic barrier for widespread mixing. Regardless, if there are gradients WITHIN countries, then why not between? Regardless of if these gradients can be explained by admixture or something else, these are not new patterns. The brain drain theory of the south is totally fair, also the view that too many people of African Ancestry slows economic growth is possible, but you look at Delaware and Maryland and see that they have been alright with large African American populations.
Being said, I will be clear that the data is mixed on if the Spaniards do have substantial African Admixture, however, that does not really negate the point . Regardless, the intelligence data is not mixed. If it is due to the cold winter theory or due to other causes, there is no reason to believe that the differences are innate.
Mathematically Calculating Between Group Heritability
Within group heritability and between group heritability are algebraically related given a few assumptions such as the same heritability in each group and no unique environmental influences — which have been shown.
The equation that is derived from this figure will be
A different method used by Jensen was the equation
Some of the assumptions are the there is no assortative mating for intelligence in biracial individuals and many others. It is very dubious method that can be adjusted.
Sandra Scarr used this formula in 1977
Depending on what method of calculating the between group heritability you use, you can get different results that typically fall between 0.5 and 0.8. Some methods will give a lot more or less.
The rising constraints of heritability can be outlined on a table as shown below.
The heritability of IQ tends to be estimated around .60 -.86 and there are people who say .40, but those are really outdated estimates that are from 10–14 year olds normally. In Russell Warne’s book, he uses a heritability of 0.5 and assumes that the black-white environmental gap is d = 0.658 (Warne, 2019b) (It is an unpublished manuscript, you can ask me for the data), which is far short of the threshold for between group heritability to be 0. In Sesardic’s Making Sense of Heritability, he comes to a similar conclusion. “Missing heritability” is not the monster in the closet that many people believe it to be. In fact, the missing heritability is likely to pile onto the existing group differences.
“Controlling for Socioeconomics” Does Not Really Change the Gaps
“the well known link between family SES and cognitive development — about 0.30 in meta-analyses (Sirin, 2005) and in the present study — is mediated genetically.” — Trzaskowski et al., 2014
I would say that it is more than 30%, but we can use this number as it is a number that includes a variety of methodologies that may reflect blind spots that I have due to my views.
Anyways, since controlling for a lot of these things is inherently fallacious. If these differences went away in net of SES, there would still be the burden of proof on the communists to show that this is the causal factor that CAUSES the IQ differences. There is strong evidence against SES being a causal factor that will also be addressed in this section.
Starting out with a famous chart from The Bell Curve,

The WAIS-IV Clinical Handbook

I know that the WAIS-IV clinical handbook takes an explicitly environmental view, however, it is worth recognizing that only a trivial amount of the African American-White gap can be explained away from their own clinical handbook. The clinical handbook also does not recognize sex differences in intelligence, however, they use the incorrect explanation of biased vocabulary. The Hispanic part does not control for admixture and that is way more pressing than with the African American-White gap because there are plenty of European Hispanics. It is important to recognize that the R² values of adding race/ethnicity are not that big, however they grow when you use admixture instead of race.
Additionally, in children’s scores are also different by socioeconomic status and races. While some may argue that this is due to prenatal health, null hypothesis should be that this a combination of environmental influence and gene-environment correlations, just as virtually every behavioral difference to between individuals and between social classes are. Gene environment correlations exist and they do not exclude race differences.
It is often said that the SAT just measures income. Unfortunately, if this was true, we would see MORE racial equality. The fact is that these gaps have been persistent. While the SAT’s are no longer as good at predicting IQ’s as they once were, it seems that any test that requires cognitive ability produces disparities. The SAT correlated with IQ scores at about .6 to .8 or so back in these years — Brodnick and Ree, 1995, Frey and Detterman, 2004, and Beaujean et al., 2006.
With socioeconomics, you actually have to tell me why poor people would do worse. Scarr et al.1976 did not not find family income to relate to black IQ in adoptions, Manyard, 1977 showed that giving families free money doesn’t improve the GPA of high school students, Maynard and Murnane, 1979 replicated these findings in 7th to 10th graders. Also, study courses for the SAT are mostly a scam. A lot of people still do not know that.
Adversity scores were cancelled due to the criticism of them, however, these are phenomenal bellcurves to help visualize.

I will finish with section by saying this: we can call all of these things racism and a system of oppression, however, at large why do white people benefit from holding black people down economically? Welfare is not good for the economy, prisons are not free to run (for profit prisons are far less industrious than one would think because the people don’t pay rent to live there). The idea that white people are functioning as a collective to empower themselves can be disputed by a number of metrics. White people are the least likely to believe in a genetic hypothesis for academic disparities in outcomes, whites do not engage in charity work that is exclusively for white people, google lets you acknowledge it is a black owned business, etc.
Brain Size Differences are not Alt Right Scams
This is not the most important topic, but honesty counts. There are group differences in skull size, and in turn, brain size. Stephen J. Gould, the author of the work that is now known as fiction “Mismeasure of Man,” claimed there was no correlation between brain size and IQ, this is simply false according to the research. Gould was a fraud who sought to portray Morton as a racist and this is just not a claim that can be substantiated.
Brain Size Across Warm Blooded Species
Between species brain size is actually more telling than within species brain size. I want to avoid misguiding anyone so I am going to say the obvious: not all brain parts do the same thing and brain size in proportion to body mass is a good idea to use as well.
Brain size has been linked to social learning and extended life histories across primates (Street et al., 2017). In humans, intelligence is linked to longevity and it appears to be genetically mediated (Arden et al., 2015). There is also some evidence of a link between extended life history and intelligence in humans (Dunkel et al., 2018).


That image on the right excludes humans, but I think that you can guess where they would fit in to that phylogenic tree — near where the bars are large. While it is possible that humans could deviate from the trend and the subpopulations within each species do not follow these trends, which is the more parsimonious explanation?
In birds, there is a link between brain size and survival in net of body mass. In general, the central thesis of JP Rushton seems to be a reasonable hypothesis worth investigating, but not one worth making grandiose claims about without further evidence.

Brain Size and IQ
On the phenotypic level, it appears that the correlation between brain size and IQ is about 0.40 (Gignac & Bates, 2017). This is a lot closer to what JP Rushton thought than what the critics (who said 0) were claiming.
Jansen et al., 2020 explored the genetic basis of the brain size and IQ. The genetic correlation from GWAS was about .24. Since GWAS gets criticism, taking it a step further and using within family data is the next line of evidence, which is exactly what Dr. Lee and others did.
“These findings give reason to take up the hypothesis that the dramatic increase in brain volume over the course of human evolution has been the result of natural selection favoring general intelligence.” — Lee et al., 2019


Race and Brain Size
Studies like Pearl, 1934 and 21st century studies like Rushton & Rushton, 2003 aren’t widely disputed in a sense of the underlying statement “races have brain size differences. The interpretation of the data is where some disagree. Brain size is one of many factors, but it is a factor in IQ. The reason that this is relevant to group differences is that Richard Lynn has estimated that it can about 1/3 of the African-European gap (10 points) and is a sign of a broader pattern of evolution. The interesting thing is that you would expect the IQ gap between East Asians and Europeans to be 35% higher (about 1.75–2.5 points) based on this. I am not really concerned about the specific details because brain size is a crude proxy for many other underlying traits that matter.
Even people who deny the uncontroversial correlation between brain size and IQ (which have overlapping SNPs), do not try to argue that the group differences in brain size are due to environment. The absence of an argument, in my mind, implies a mutual understanding, but maybe you can find somebody who would disagree, I do not know. Given the incredibly high heritability of brain size, you can use the rising constraints of heritability method to calculate the probability of race differences in brain size relative to body size being due to environmental factors — it would require an x-factor.

As far as why we can tell they are genetics, there are several lines of evidence that make this highly probable. There are race differences in birth canal size (Rushton, 2003). The genetic belief is fortified by the fact that race differences in brain size at birth are also observed.One study, found that African American babies had smaller heads amongst low SES families compared to white families in low SES. There were no group differences in reported alcohol use or cocaine exposure, but the white women smoked much more (Goldenberg et al., 1991). Emil has an entire page on the brain size of the very young.

Additionally, there is corresponding knee joint angle data from Rushton that corresponds with the races as well. These patterns are what Rushton described as “cascading effects throughout the body,” which accommodate for larger brains. The straighter knee joint provides a more stable platform to support a larger brain and this tends to be a pattern across animals.
Additionally, the race differences in sitting height ratio, which are near certainly due to genetics (Chan et al., 2015). Having relatively shorter legs lowers the center of gravity and improves stability. This is needed because more cranial mass will reduce balance/stability during locomotion.
In Race Evolution and Behavior, Rushton wrote;
“For example, blacks have less body fat, narrower hips, thicker thighs, longer legs, and lighter calves. From a biomechanical perspective, this is a useful package. Narrow hips allow for efficient, straight-ahead running.”
Not all of this has been proven to be due to genetics, but the brain size is probably correct when considering the totality of evidence, it seems that the muscle fiber differences being due to genes will be the prevailing opinion when genetic epidemiologists start to explore the issue of pulmonary function more, and the legs being longer. (relative to body size) has strong evidence in the form of “probabilistic causal SNPs,” so I think that with time, almost all of Rushton’s hypotheses will be vindicated. More evidence of differences in life history traits will be presented later.
If you are still not sold on race and brain size, here is a map of the global brain size distribution (of the indigenous peoples), it should be mutually understood that there was an evolutionary basis to it. Arguments against race and brain size have been that 1) Brain size and IQ are not correlated (false) and 2) Race differences in brain size do not exist (also false).
The argument that they exist but for environmental reasons is not only wrong, but, it is a last ditch and bad faith effort similar to saying “well climate change is happening, humans are causing it, but we do not know if it has anything to do with fossil fuels specifically.” There are people who really believe that in good faith. People also believe that the group differences in brain size are due to environmental reasons.

Contrary to popular belief, Richard Lynn was not the first person to come up with the idea of the cold winter theory, and it is relatively mainstream — not consensus for sure, but not a view held by only like 4 people. The reason that Lynn is given credit for it is probably to make it easier to slander.
The last point that I want to make is that it is very unlikely that there are differences in brain size and nothing else related to intelligence. Even wikipedia acknowledges this despite their stance that race realism is “pseudoscience”:
“At genetic level, co-adaptation is the accumulation of interacting genes in the gene pool of a population by selection. Selection pressures on one of the genes will affect its interacting proteins, after which compensatory changes occur… Similar to traits on a genetic level, aspects of organs can also be subject to co-adaptation.” — Wikipedia
To answer the question you may have on the inuits large brain size and intelligence scores that are not very high, there are two reasons:
“Arctic People have always been a small population. At the end of the twentieth century they were only about 56,000, compared to about 1.4 billion Asians (!). Although it is impossible to accurately estimate the population size during the main glaciation, there is no doubt that Asians far outnumbered the Arctic peoples. The effect of the difference in size of the population was that advantageous mutations for a greater intelligence were much less likely to appear in the Arctic People. However, it is interesting to note that they have the largest cranial capacity, pointing to evolutionary processes at work.” — human-intelligence.org
Also, agriculture was a way of selecting for people with higher IQ’s. There was minimal agriculture going on amongst the inuits due to the constraints of the climate. This is not a particularly mind blowing idea.
Reaction Times
It is widely accepted that people who are higher in IQ tend to have better reaction times. A good example of reaction times at play is video game players. Many very good video game players are also high IQ, I have heard (not a gamer myself). The correlation is not perfect, however, this is evidence that g is more so a biological property and nexus of human mental functions.


While these are not certain to be due to genes, this shows internal consistency in the race realist view. Some environmental only explanations such as culturally biased on IQ tests cannot explain these differences in reaction times. It has been argued that reaction time data does not matter by James Flynn, and it is probably like the Eyferth study where he misinterprets the data to be honest.
Non Trivial Impacts of Some Trivial Genetic Differences
No population genetic differences are too small to make IQ differences. This seems like a really obvious observation, but I guess it isn’t. Here are Fst values for European populations (Tian et al., 2009). This is not to say that Fst is a good measure of human biological diversity or that it is not going to give an underestimate, but if you know you know. They are not the worst thing in the world.

It is widely accepted that the AJA average score is somewhere between 8 and 15 points higher than average within the white population, despite incredibly low genetic differentiation. Also, it is ok to attribute this gap to genetics in polite society (eg Steven Pinker) because it is not particularly easy to argue against (Cochran et al., 2006). While this does not PROVE that the black-white gap is due to genes, it certainly implies that it is not unreasonable for groups that are “99.9%” the same (not a real number — that is an outdated estimate of parent offspring similarity that Bill Clinton was told; on the surface that is absurd given that the X and Y chromosomes exist which makes this mathematically impossible).
Side Note For Readers Since I Brought Up Jewish People
I am not interested in talking about AJ’s and it only comes up in the IQ stuff from time to time. I strongly advise avoiding the Q Anon stuff. It also looks really bad on me when I hear that people who deny evolution cite me, people who believe in Q Anon or election fraud cite me, etc. Please, do not cite me if you are a conspiracy theorist. If you are a holocaust denier, please stop that frivolous shit. I understand that holocaust denial is exponentially more realistic (1% chance it isn’t real) than the environmental explanations (0.0001% chance), but the holocaust actually happened. My source is “trust me bro.” If you read this far and trust that I did not cherry pick everything, why not trust me on this? I am as far out there as it gets on the scientific matters by favoring the r/K perspective.
Woke Biometrics vs. Real Biometrics
Non-race realists that try to use biometric data rely on bad calculations and caveman math. There are quantitative limits to fixation index since human subpopulations are arbitrarily defined (Ochoa & Storey, 2019a; Ochoa & Storey 2019b; Ochoa & Story 2021* *doi linked, being published next month). Nobody is going to convince me that I am wrong with the orthodox Fst values. Those simply cannot and will not provide enough evidence.
Take this paper that will be published in some woke anthropology journal soon — DOI is linked (Bird, 2021). Will be referring to the author as Lying Kevin. I do not think that between group heritability should be put in an R² to begin with because you are squaring the difference between two variances. Delta R²^² is a computation that seems odd to me. Next time I need to square a variance, I will call Lying Kevin!
Lying Kevin gives an upper limit heritability of 50% for g. His own sample had with group heritability of g that was 66.5%! Simply changing this moves the between group heritability using traditional computations to be 17.14% for the Africa vs. Europe scores. In his paper, his source for the heritability estimate gives an MZ correlation of 0.68 and a DZ correlation of 0.28 — that is a heritability of at least 0.80 because you also have to correct for assortative mating.
Next, Lying Kevin misrepresents the effect. He erroneously converts the R² to D using a 1:1 ratio. The problem is, the R² conversions to a cohen’s D effect size is not a 1:1! The answer is no. A large effect size is a large effect size.


Another thing is that nobody thinks the gap between Europe and Africa is 100% genetic. The authors of the original paper estimated a genotypic gap of 0.85 standard deviations and a phenotypic gap of about 2 standard deviations. If the original paper says that it is 42.5% between group heritability between Africa and Europe and the “debunking paper” says it is 12% between group heritability without correcting anything. Even with all of the errors, the proper interpretation of the numbers that Lying Kevin spit out, he will get you more than 1/4 of the way to the the initial claim. The initial claim was a correlation of 0.411 between European ancestry and polygenic score for g. Lying Kevin offers a correlation of about 0.35 between European ancestry and g. He got the same results and just interpreted them incorrectly!
Nutrition and Lead are non-Issues for Race Differences in Intelligence
Food deserts are a product of insufficient demand for the certain products that make it count as not being a food desert, so that is one check off the list. The heritability of diet is not the strongest in the world, but is real to some extent. Interestingly I have read the heritability of high sugar consumption to be as high as 48% which does not mean there is a sugar eating gene, it means the traits associated with eating sugar are heritable (impulsivity, taste sensation, etc.) so when people start blaming the education system for group differences in diet, well, what parts? Can we just assume that all people even taste food the same way? While I support interventions to help people, we cannot move on with radical ideas that population level differences are not typically at least partially genetic in origin.
Anyways, for an in depth dive on nutrition, lead, and other topics, you can check out a document called “The Secrets Of The Cakes” by Wehrkatze. He looks at vitamins A, B12, C, D, and E as well as Iron and Iodine.
“Totalling up all effect sizes, the most charitable possible estimate of the influence of nutrition on the IQ gap is 0.4455/15ths of the Black-White IQ gap accounted for. This is certainly an overestimate because in addition to the problems thus discussed, iron also somewhat impacts IQ [723 & 714]. The negative g-loading of effects [850] also raises concern for etiological relevance.”
My personal view on this topic is that you have to be INCREDIBLY unintelligent to believe that these nutritional inequalities cause cognitive inequality. The first place that your body will divert energy to is your brain. You will have bones and muscles decay before your brain is deficient. Think about going on a diet and losing 50 pounds — does your brain lose any mass despite you being in a calorie deficit for probably a couple years? The degree of malnourishment required to cause cognitive losses is so intensive that you just do not see it in America to the extent that it could cause massive differences along racial lines. I have studied health science at the university level and you are incredibly far from reality if you think that we have not done things like fortify breakfast cereals, enrich flour, etc. to solve the problem of malnutrition in America.
And for Lead:
RCTs on the effect of lead exposure on IQ do not exist because giving people lead poisoning is obviously an unethical research practice. However, longitudinal data for the effect of lead exposure on IQ from 7 studies controlling for potentially confounding variables including race, sex, birth weight, birth order, maternal education, maternal IQ, maternal age, marital status of parents, prenatal smoking status, prenatal alcohol use, and HOME inventory score link Lead Exposure to lower IQ [724]:
This is not experimental, but it’s the best we have. One potential concern is that the relationship between race or lead exposure and IQ have different etiologies; the Black-White gap has a g-loading of ~0.5 [see more here] while lead exposure effects have a g-loading of only ~0.1 [725]. A review of 5 national samples from 1988 to 2004 found that Blacks had a mean BLL that was ~1.4 ug/dl higher than Whites [726]. However, this gap has since disappeared [727]. Using the most recent data available, Blacks have a mean BLL about 0.5 ug/dl higher than Whites which is 6.57% as large as a 7.6 ug/dl difference (10–2.4). Assuming linearity with the longitudinal data, this should have an effect on IQ about 6.57% as large as -3.9 points, which is 0.26 points. Though assuming non-linearity, even back at the peak of the gap, it would be hard to imagine lead having more than a 1 point effect on the Black-White IQ gap, so to be charitable I’ll say that the effect on the gap is 1 point. However, since there is no evidence for racial Scarr-Rowe effects, we would assume that the totality of all environmental effects affect the gap linearly [see more here].”
Bending Over Backwards For Race
The g factor is the most well replicated phenomenon in psychology, it persists across the lifespan, and the people designing AI favor the general intelligence approach (Chollet, 2018). If g is an invalid concept, then you are going to have to abolish psychology. This is not being hyperbolic.
James Flynn:
The response of many g-men to IQ gains over time is to say: “You grant that gains on various subtests do not correspond to how well each subtest measures g. Well, that shows that the gains are hollow, that is, since they are not g gains they are not real intelligence gains and lack significance.” As you can see, this is just a way of saying that if all complex cognitive skills do not move together — that if they have different trends — then the trends just cannot be significant. This is the saddest result of the obsession with g: it makes the limitations of the concept no longer a matter of evidence. Any evidence that challenges the supremacy of g is not good evidence because it challenges the supremacy of g and that is that. — Flynn, 2007
He does not seem to understand what the concept of g is. Below is a power point slide below that shows what g is. There is overwhelming evidence that g is a naturally occurring phenomenon. As mentioned earlier, g is more heritable than any given subtest, there are things known as Jensen effects, etc. The point is that the IQ test wants to measure the thing in the middle of the venn diagram, but it also catches everything else. If the gains in scores on an IQ test are mostly outside of the center, they are considered hollow. This is not rocket science.

Eric Turkheimer (I just call him “Nasty Eric” because he says awful things)
“Flynn says, “There is nothing really the matter with the concept of g,” as long as one is interested in the level of individual differences in ability, as opposed to development in time within individuals or across generations. You can’t help but notice that his concession doesn’t prevent him from being ripped, in Gottfredson’s reply, for not taking g seriously enough, for not placing it at the very center of the entire discussion. It’s the price he pays for giving up too much. There is plenty, indeed practically everything, wrong with the concept of g, even in its classical context of individual differences in ability among adults at a single point in time. Explaining why requires some slightly technical concepts — bear with me.” — Eric Turkheimer, 2007
He goes on to basically explain sampling theory, and the problem with sampling theory is that it is (1) Unfalsifiable. Part of the theory is that it includes mental abilities that are too fine to measure, so there is no way to falsify definitively that they are uncorrelated. My question is “can you prove that these finer abilities are uncorrelated?” (2) Does not make sense in light of existing evidence. The subtests that are more similar would be expected to correlate the strongest infallibly under sampling theory — this is often incorrect. (3) Does not contradict g. Okay, so what if they are sampling uncorrelated abilities? It literally would not matter because whatever the common factor of variance on IQ tests measures is some powerful stuff.
He seems to have moved onto the model called mutualism (Nisbett et al., 2012) but I really do not know — the dude is a communist and should be ashamed of himself.
In 2015, his interview with Stefan Molyneux contained the quote “well, I am not entirely against g” when confronted that he has been very critical of g. I am unsure if he changed his mind, but I doubt it — probably just trying to pretend to be a serious person.
Another interesting thing about Nasty Eric is that he does not believe in evolution:
“If you were persuaded by Murray and Harris’s conclusion that the black-white IQ gap is partially genetic, but uncomfortable with the idea that the same kind of thinking might apply to the personality traits of Jews, I have one question: Why? Couldn’t there just as easily be a science of whether Jews are genetically “tuned to” (Harris’s phrase) different levels of materialism than gentiles?” — Nasty Eric, 2017
Question (1): The reason is simply that people are more uncomfortable with stereotypes about Jewish people that are associated with Nazism. This is also a less reasonable hypothesis, as will be answered as part of question 2.

Question (2): No. It is unlikely to be the case. Materialism is not as evolutionarily important trait the way intelligence is.
Transracial Adoption Studies
My freshman year of college, a professor of mine cited these and said that group differences were genetic in origin. Here is what we know: gains from the adoptions are not positively correlated with the factor loadings —gains from the adoption studies are hollow.


The strongest evidence is the Minnesota Transracial Adoption Study. Many confused people like to cite this study however, the Flynn Effect effect is not relevant to race differences, there was “attrition” that uniquely impacted the white IQ, and it was reported that there was some fraud:
“An interesting parallel to this work is our longitudinal study of interracial adoptees. At the average of 7 years, the African-American adopted children scored 106. I on IQ tests. By the average age of 18 however, their IQ scores had declined to 96.8. Children with one White and one Black parent scored, on average. 109.0 at age 7 and 98.5 at age 18; children with two Black parents (and later adoptive placements) scored 96.8 at age 7 and 89.4 at age 18. The test performance of the Black/Black adoptees was not different from that of ordinary Black children reared by their own families in the same area of the country. My colleagues and I reported the data accurately and as fully as possible, and then tried to make the results palatable to environmentally committed colleagues. In retrospect, this was a mistake. The results of the transracial adoption study can be used to support either a genetic difference hypothesis or an environmental difference one (because the children have visible African ancestry). We should have been agnostic on the conclusions; Art would have been.” (Scarr, 1998)
Art is referring to Arthur Jensen. It is pretty strange how he is very well respected by various figures that strongly disagree with him, but if you go on google and look for him… YIKES! People say he was a terrible racist.
In fact, Sandra Scarr herself had already co-authored a paper that said:
“We think that it is exceedingly implausible that these differences are either entirely genetically based or entirely environmentally based.” — Waldman et al., 1994
Most people do not argue that race differences are purely caused by genes so that is sort of a stawman way of saying “you are right” without actually saying it. The Waldman et al. paper also tried to downplay the results of the Minnesota Transracial Adoption Study. It is important to understand something — the fact that the Asian/Native American was a pooled sample and only a sample size of 12 makes them not really useful. The main takeaway from that paper to me is that black/white biracial adoptees raised in white homes do not show IQ scores any higher than that which would would be expected based on their ancestry. Other sample sizes were small (fully black kids; n=21), I would not accept 21 as a sample size to change my mind.
James Flynn’s 1980 book included a part where he wanted to more studies of transracial adoptions because he was a true believer at the time. I am unsure as to if he died a true believer, as he seems to have been willing to die on the hill that g isn’t all that.
Here is an image from a medium writer’s paper that I would have recreated myself, but many people reading this have already read his work I assume (Tahir, 2019). He unpacks that East Asian IQ scores vs whites in transracial adoptions.

More “Pseudoscientists” than “Scientists”
There is no official consensus, however, based on various surveys over the decades, we can sort of tell and there are not many people that matter who did not believe in this.
Are there any cool people who believe in an environmental cause?
People that are at least somewhat known for beliefs on IQ stuff (in no order) are: James Watson, Charles Spearman, Richard Lynn, Hans Eysenck, Arthur Jensen, JP Rushton, Elizabeth Rushton, Linda Gottfredson, Charles Murray, Ian Templer, Satoshi Kanazawa, Heiner Rindermann, Richard Haier, Noah Carl, Jay/John Lasker, Nathan Cofnas, Emil OW Kirkegaard, Richard Herrnstein, Ben. and Bo Winegard, Jason Richwine, Russell T Warne, Bryan J Pesta, John G.R. Fuerst, Davide Piffer, Craig L. Frisby, A. Alexander Beaujean, Edward Dutton, Micheal Woodley, Helmunth Nyborg, Earl Hunt, Jan te Nijenhuis, Michael Levin, Claire Lehmann, Jonathan Anomaly, Thomas Bouchard, Leslie Jones, Nevan Sesardic, and many more.
I do not see a high unemployment rate bunch here — a few have been removed from academia but for whatever reason, the research is frequently still funded. It is almost like people KNOW that they are not squandering money trying to prove that the moon is blue cheese here. Why are so many of these people employed by universities if it is not a totally legitimate hypothesis?James Flynn has said that it is a reasonable hypothesis himself: “ The hypothesis is intelligible and subject to scientific investigation” (2017) and should be respected by most people (I have contempt for his work that resembled activism more than science, but rest in peace big guy — a truly honest man).
Surveys by Rindermann produce low response rates, (2016 and 2020) but with a degree of certainty, we can assume that it is not a minority of experts who believe that there is at least some genetic aspect to group differences — in fact under 1 in 5 believe that there are no genetic differences according to the results we have seen, this matches the percent that didn’t like the g factor theory of intelligence.
Regression to the Mean
Siblings provide an even better comparison than parent-offspring comparisons because siblings share very similar environments. Genetic theory predicts the precise magnitude of the regression effect. In one study, Jensen [21] tested the regression predictions using data from 900 White sibling pairs and 500 Black sibling pairs. When Black and White children were matched for IQs of 120, the siblings of Black children averaged close to 100, while the siblings of White children averaged close to 110. A converse effect was also found for children matched at the lower end of the IQ scale. When Black and White children were matched for IQs of 70, the siblings of the Black children averaged about 78, while the siblings of the White children averaged about 85. Throughout the range of IQs from 50 to 150 the results were exactly as predicted by genetic theory, not by culture-only theory. — Rushton and Jensen, 2010
Clearly, an IQ of 70 is a greater aberration for one group than the other and this is within families (read genetic). Considering this in the context of environmental explanations using shared environment as the cause of the difference, it seems unlikely to me.
This also runs contrary to the possibility of equal genotypic bell curves and the shared environment driving down the black bell curves a lot. The reason is simple — if the genotypic Bell Curves are different because of SES (say that explains half of it) and the shared environment explains the other half — why is it that the siblings are lower IQ than white siblings at a respective IQ level across the ENTIRE IQ distribution?
Cultural Arguments are Inadequate
Some people (like Thomas Sowell or Flynn) suggest that the black culture is bad, not the tests. Transracial adoption studies, admixture, and measurement invariance all disprove this, but there is more on a theoretical basis. If culture was manipulating IQ’s, that would still have an impact on fertility patterns and lead you to a partial genetic explanation.
Richard Nisbett’s dumb book also stresses culture, but the problem with his view is very basic — Mexican immigrants that come to America assimilate into an underclass in successive generation. There is a decay in work ethic, marriage, law compliance, etc. but the IQ does not change. Another example is that the Minnesota Transracial Adoption study was done and showed that there was no effect of adoption (Richwine, 2009a; Richwine, 2009b)
Fertility and Intellect by Race

We can observe the fertility pattern of both blacks and whites. The facts are the facts. Black cultural differences are the probable cause for the differences in fertility. This is a rather peculiar argument to me. How could it be within the realm of possibility for the black and white IQ’s to be just a product of cultural differences when we know that 1) IQ has the same heritability in both black and white Americans. 2) Blacks and Whites exhibit different fertility patterns. 3) IQ tests measure the same things in both blacks and whites.
A fair objection is that we do not know if there was always the same heritability. The best piece of evidence is the famous survey (Snyderman and Rothman, 1987), which did indicate that of those who were willing to estimate — they tended to agree that there was about the same heritability in each group.

Ultimately, I would point out that there is fertility by education level to this day. Many Hispanics are immigrants which gives some degree of bias against them, but the black-white stuff is what really matters for this. Let’s say that the average college graduate is like 105 IQ in whites, a 2 year degree is like 95 IQ and less than that is 90 (I am a skeptic that you need to be smart to get a 4 degree these days). Do a 10 point adjustment and that is what the black population is at each education level in my opinion. Regardless of what numbers you pick, the rank order of IQ by education level is unchanged within each race, at each level of educational attainment, the white IQ is higher too.
Global GWAS Data
One study (Piffer, 2015) used 9 SNPs to estimate national IQ’s. Some say that the this is “meaningless” and that is incorrect. SNP data is useful. What is most important is that this taps into the fact that there are common SNP variants driving these differences. This means that international differences are not due to rare SNP variants.
“The average frequency (polygenic score) of nine alleles positively associated with IQ and proxy phenotypes at the individual differences level in published GWAS is strongly and significantly correlated to population, or country IQ (r = .91). Factor analysis of allele frequencies yielded a metagene factor with a similar correlation to IQ (.86). The majority of alleles (seven out of nine) loaded positively on this factor.” — Piffer, 2015
Piffer, 2019 showed that the EDU3_PGS population IQ’s correlated strongly.

When lumped as regions (what we do when when we talk about population clusters), we find an incredibly linear pattern for the EDU_PGS.

If the African American estimate was not so charitable, we can imagine the slope being steeper with a lower intercept and an even better linear fit.
Heritability Rises With Age and Gaps Widen

The gap in intelligence between a puppy and a human baby is smaller than the gap between a fully grown dog and a fully grown man. This is not only due to the fact that the dog does not go to school and eats lower quality food, this is largely because gene expression increases with the development of an organism. For example, many African Americans are much lighter skinned as babies than as adults, many caucasians have blonde hair as a baby and it gets darker with age, and traits like a big brain take time to grow. The increasing genetic influence with age is called increasing gene expression — for IQ scores, the increasing gene expression with age is known as the Wilson Effect.
The environmentarian superstar of the last 50+ years, James Flynn (who I have heard is not well), noted this. A guardian article about him titled “Beyond the Flynn effect: new myths about race, family and IQ?” stated:
The answer to the question in the title, Flynn explains, is that your family environment’s effect on your IQ almost disappears by the age of 17. An important exception is in the vocabulary component of IQ tests, where the effect persists into the mid-20s and can make a big difference, at least in the US, to the chances of getting into a top university. The home has most influence in early childhood but is swamped by later environments at school, university and work. And they will more closely match your genes because you will seek out (and be chosen for) environments that match your “genetic potential”, whether it’s basketball, carpentry or mathematics.
An environmental hypothesis would predict that these IQ gaps get smaller as the environmental factors become less important. This does not appear to be the case. These IQ gaps increase with age.
This is the second indication of this fact, the larger the share of the variance that can be attributed to genes, the greater the group differences become.


It is possible that gene-environment correlations move from passive to active, but it is a normal pattern for gene expression related to the brain to change with age (Berchtold et al., 2008). It is also important to recognize the math that goes on here.
African Americans are Richer than Most Europeans
There are people who believe that welfare can increase intelligence and if we just were more like Europe and had free college, medicare for all, etc., we could raise the the intelligence. Unfortunately, that is not true. The findings of the Abecedarian Head Start program do not replicate, are not gains on g, and they did not control for initial cognitive ability.
The median household income on a monthly basis for African Americans is uncertain to be exact, but I have a few estimates from 2019. African American median monthly income : $3,786(Statista) $3,655(ACS data). Here is more recent data for Q3 2020 (BLS data):
Among the major race and ethnicity groups, median weekly earnings of Blacks ($813) and Hispanics ($785) working full-time jobs were lower than those of Whites ($1,008) and Asians ($1,392).
813 x 4=3252 a month (Really a month is about 4.33 weeks which would get you to 3520 month) which is a bit down due to the pandemic. It is worth noting that the White-Asian gap is smaller than the Black-White gap in income and the Black median income is higher than Hispanics. The number from 2019 was higher than ANY European country, but I decided to be charitable.

So you can call it what you want but black Americans have higher incomes in terms of purchasing power than all of Europe, but generally much lower IQ’s with a couple of exceptions — which are nations that often look a lot more like Central America than like first world nations in terms of economic development.

Neurological “Disparities”
I am unconvinced that hypertension CAUSES brain differences between the races. While I am not saying it is impossible, if these disparities were caused by hypertension, well, that is still genetic. If white people are more tolerant of high blood pressure for genetic reasons, so be it. Moreover, a large share of the disparities in blood pressure are genetic in origin (see medical racism section).
Chand et al., 2017 found “disparities” in insular thickness and connectivity between the groups. I disagree with the a priori assumption that group differences in this case MUST be caused by different responses to high blood pressure. These differences are linked to differences in cognitive ability.’
You can identify somebody’s ancestry from a brain scan (Altmann and Mourao-Miranda, 2018), as it would not be possible for there to be racial bias if there were no differences. Arguments for there to be biased brain scans is evidence against race being a social construct.
r/K Check?
It is pretty uncontroversial that there are life history traits in humans that were selected for as a function of wealth in European nations (Pettay et al., 2017). A common straw man argument is that there is plasticity to these life history traits — okay, and? Nobody said that heritability=non malleability. The high heritability means that within the demographics, the rank order is not going to change much (Wells & Stock, 2011). Humans have gotten taller, but if you are taller than most of your peers, there is a higher probability that your ancestors were taller than their peers than the probability that a short person’s ancestors were taller than their peers.
Violent Crime
Some say that living in a violent neighborhood is bad for development. One of the problems with this is that has to address why the neighborhood is violent. I think that race is a better indicator than general SES because that is what the data shows!


The author of the woke fiction, “Freakonomics” did a study on the dynamic between race, SES, and homicide in Chicago over the course of the back end of the 20th century. The results clearly indicated that the link between homicide and income, when broken down to the census tract level, really are dependent on race (Levitt, 1999).
These sorts of figures are a persistent pattern that exist all across the nation and there is no way to deny it seriously.
Below is a scatter plot of the homicide rates by county from the 2020 county health rankings, this was made in JASP, so it may be a bit misleading since JASP cannot weight the data. Considering that the X axis and the Y axis are different and it is on a log scale, I find it incredibly difficult to argue against the race homicide link, in America.

A fair criticism is that the white people within each county will be richer than the black people within each county, so here are two graphs below and their respective equations — the log scales for the homicide rates are still different.


Range restricting to counties where black people have higher incomes than Hispanics, there are still race differences in homicide rates there. The effect sizes are a little bit inflated because of the log transformation, but there is a gap in homicide rates that exceeds the income gaps.

Using the same data from the 2020 County health rankings, I threw together a regression that is really unbiased in a sense that it controls for a biological variable that is linked to race and life history strategies (low birth weight).
The variables are hard to read because I had to download a statistics program that is kind of sketchy to do this by weighted methods, but here we are.
This is a regression for the 500 largest counties (most Americans live in these counties — less sampling error by using them)
Controls are as follows: less than 18=% under 18, “and_over”=% over 65 years old, income ratio = 80 percentile income/20 percentile income, Infant mortality rate (proxy for general wellbeing), and median household income are as stated.
They can collectively explain half of the variation in county level homicide rates amongst the 500 largest counties — even if not necessarily causal.

Below are unweighted scatter plots


Below is an output of the bivariate correlations when weighted for county size. Using this method, the correlations are actually pretty solid.

Now, you could say that maybe the black people in the county are not the ones committing the homicides, but which is a more parsimonious explanation?
These sorts of patterns are a global trend that is impossible to deny.

The image below comes from JP Rushton’s masterpiece “Race, Evolution, and Behavior” and the one flaw with it is that he included the south Asian nations as Mongoloid — this inflates their homicide rates, and there is too much genetic drift from the more true population, North East Asians.

For example, in China and Japan, the rates are much lower. Also, using a weighted means will allow China (under 2.7), to drag the average down a lot.

Japan has had similar homicide rates to China — incredibly low.

The link between race and homicide is exceedingly uncontroversial and it is not one that can be denied in good faith.
Birthweight/Childhood Mortality
In America, ethnic norms for birth weight are not politically correct — it is true that they exist thought. A lot of East Asian babies are incorrectly labeled as low birth weight because of this. The outcomes of low birth weight babies by race is an area of large disparities, why are there so many black babies with low birth weights?
It is impossible that there is a non-genetic explanation weight the weighted low birth rate (subject to a bit of reporting bias because counties often are embarrassed to admit their stats on black maternity), produces a difference an order of magnitude greater than the differences in IQ. Hispanics have a similar poverty rate to blacks and look a lot more like whites than blacks.

Black women are much more likely to have a low birthweight babies and this persists in net of socioeconomics and other demographic variables. We also have to consider that on average, African American women that get higher levels of education have more non-African Admixture.


It is highly unlikely that disparities of this magnitude are based purely off of racism. Hispanics have lower access to healthcare than African Americans. Asians being classified as low birth weight is a misleading category in my opinion. We do not have racial/ethnic norms that match the reality of racial/ethnic norms in biology.
In childhood, this pattern is persistent. The Hispanic/White gap is just not all that big of a deal, then you see “socioeconomics” appear out of thin air and start to make a big deal for blacks.

Using SPSS, I took the common factor of variance between county level Low Birth Weight rates, Child Mortality rates, and Infant Mortality rates.

Unfortunately, I cannot show this as a bubble plot because the SPSS ran out of memory! Here is the weighted bivariate correlation — the number is unfortunately below the total US population because not all counties report their values, but the counties that do not report are often the ones hiding racial inequality of outcomes because that is a mark of shame in the united states.

I also did weighted matched pairs T test with the range restricted to the counties where for the median black income is higher than the median Hispanic income.


Math scores are 3rd graders math level. So a 2 means that they are 3rd graders doing 2nd grade math on average and a 4 means that they are doing 4th grade math on average. Do not think that this means I am super pro-Mexican immigration, but I am not gung ho about the idea of mass deportations because most Mexicans just need to be in the right environment and they can contribute to society (even if this means voter suppression).
Breast Feeding
Breast feeding differences also tend to converge with the life history strategies. The belief that we should merely consider this a cultural difference is unfounded.
“Breastfeeding rates differ between racial/ethnic groups in the United States, resulting in considerable health disparities for infants. Black infants are breastfed for substantially shorter periods compared with white infants, and Hispanic infants are breastfed for significantly longer periods.” — McKinney et al., 2016
Hispanic women breastfeed longer and do not have kids with higher IQ’s than whites, even when matched for SES. This strongly implies that the breastfeeding is not a cause of the racial/ethnic differences in America.
I would have to see evidence that there is a relationship between IQ and breastfeeding that produces gains that correlate with g loadings similar to the way that the race differences do.
Developmental Milestones
There is a also a considerable heritability of different motor development. There are some superstitious people who may believe that the cultures cause the phenotypes as opposed to believing that the genes and the cultures co-evolved. I think that since it is a global phenomenon where African babies develop faster than East Asian babies who develop slower than white babies, it should be taken as “probably genetic” since changing the countries and cultures does not change the rank order.


It is not just the babies that walk first, this is a general trend for all of development.


This incredibly strong evidence for differences in life history traits — see evolutionary biology section if you are mad that I think that it is partially because of genetics. Many of these have been argued as a basis for black intellectual superiority, which is fine, they are free to argue this. There is no reason that it should be off limits to argue differences in life history strategies.
For the same reason that I cannot correlate IQ scores to race and use a correlation to prove causality, people should not find a simple correlation and assume that it is a causal relationship (or at least expect others to take it at fact value). I find it unethical to tell black people that their culture is to blame for their misfortunes without any hard evidence for it. This sort of “black people need to be better” stuff is no better than “white people need to be better.” The reality is that it is nobody’s fault. Should black culture be better? Yeah, it could improve — but being honest with them is much better than blaming their culture for their IQ scores.
Prenatal Environments
Additionally, the prenatal environment is something that you really inherit in a way. If your mom has some weird blood trait that causes you to not receive enough nutrients, you are highly likely to inherit this trait to some degree.
For fetal hemoglobin levels, Bao et al., 2019 estimated the heritability to be 31.6%. Compared to other blood heritability estimates, this is very low and should be considered as a possible deviation from the norms. A different study, found a narrow sense heritability of 60.9% and a broad sense heritability that 70.8% for fetal hemoglobin in twins (Pilia et al., 2006). The 2019 study was in sickle cell patients, so the results are less generalizable than other studies.
Most blood traits tend to have a considerable heritability. The confidence intervals for some traits in this study from 1999 are rather large, so more recent studies should be considered.

Some more recent estimates are a bit more conservative and suggest 41% for hematocrit and 45% hemoglobin levels (Lin et al., 2005). Interestingly, red blood cell count has had higher estimates which appear to exceed 70% heritability (Mahaney et al., 2005). I think that it can be said with a comfortable degree of certainty that the numbers for all parameters are somewhere over 35%, which implies that genetics are a non-trivial factor.
Heritability is not a pure estimate of the degree to which a trait is malleable, but it is the best estimate we have. One of the biggest blunders of modern science is debating the legitimacy of twin studies, heritability, and many other things — basically, the argument will forever be “you may not acquire the knowledge by which you would figure out the truth, you must act as though there are no differences.”
There seems to be developing consensus that race is a factor and there is a whole range of interconnected traits that centers around the muscle fiber type and the bodily demand for oxygen.

“Accumulating evidence suggests that various physiological factors (e.g. hemoglobin levels and muscle fiber type) may help to explain lower aerobic capacity in non-Hispanic Black subjects [11, 24–28]. Additionally, imbalances in these physiological structures (reduced hemoglobin and greater percentages of type II muscle fibers) are associated with several metabolic abnormalities (hypertension, type 2 diabetes) [12] and may help to explain a portion of the health disparities seen between non-Hispanic Black and non-Hispanic White subjects [10–12].” — Ceasar & Hunter, 2015
To sum that all up, African Americans have more type II muscle fibers as a percentage of muscle mass. Type II fibers do more anaerobic metabolism. This is highly likely to why they have lower lung capacity and lower hemoglobin, though to some extent, the environment may be a factor. This could explain race differences in the rate of physical activity. If cardiovascular exercise is more taxing, they will do it less.
One study concluded
“Hemoglobin levels were substantially lower in black children (120.3 g/L) than in white children (126.8 g/L). Hemoglobin concentrations were also lower in black women (128.4 g/L) than in white women (133.9 g/L), and in black men (144.8 g/L) than in white men (153.2 g/L). Blacks had lower hemoglobin concentration than whites at most levels of dietary iron intake, serum ferritin, transferrin saturation and erythrocyte protoporphyrin. Despite their lower hemoglobin levels, blacks had higher serum ferritin levels than whites. These results suggest that the difference in hemoglobin concentrations between blacks and whites in the United States is the result of factors other than iron intake and iron status. More specific investigations of both the genetic and environmental determinants of iron utilization in blacks are needed.” — Perry et al., 1992
A study of young Americans revealed
“New criteria, based on population distribution of hemoglobin levels, may be needed for defining anemia and polycythemia in black populations and cigarette smokers.” — Cresenta et al., 1987
and a study of post menopausal women revealed
“These data suggest that differences in Hb and aerobic capacity of muscle are related to reduced VO2max in AA women. However, Hb and aerobic capacity of the muscle can only partially explain the racial differences in VO2max.” — Hunter et al., 2001
So these are differences that are persistent across the lifespan and appear to have a mix of genetic and environmental factors. I think that it would be sort of dumb to argue that there is NO genetic differences or that there are NO environmental differences.
The serum iron levels has always been a red herring in a sense that iron is not a part of the body and is something that the body uses. If the differences in groups is that they do not have the proper blood composition to process the iron, why does it matter? One reason that foods are better than vitamin supplements is that your body cannot process that much nutrients all at once and just removes the excess through urine. If the threshold at which African Americans meet their capacity of iron intake and just urinate it out is lower than that of whites, it is not the end of the world — it is not outside the realm of possibility to use methylation therapy to change the rate at which hemoglobin is reduced and see if this helps the race differences. The problem is that people would have ethical objections.
This is a reasonable hypothesis, sorry if you think that it is insulting, the human brain requires a lot more oxygen than that of other organisms. As far as the issue of East Asians, using the method of correlated vectors, we can see that the differences between whites and East Asians is of different etiology.

What exactly is serum iron and why do people correlate it to IQ? Serum iron is the amount of iron in your blood. It is stored in hemoglobin. Hemoglobin is a protein found in erythrocytes — red blood cells. The amount of red blood cells that you have called RBC count. There are race differences in all of these things and the only one one people talk about is the serum iron levels because of their internal biases and they would sound silly making more biologically literate arguments.

Hematocrit is the proportion of the blood volume that erythrocytes occupy and MCV means mean corpuscular volume in this context. Corpuscular volume is referring to the volume of the red blood cells.
Among age-matched subjects of the same sex, the average hemoglobin level was higher in whites (0.72 g/dL in women; 0.58 g/dL in men) as was the hematocrit level (1.55% in women; 0.92% in men). The average MCV was also lower in African-Americans (2.99 fl in women; 2.72 fl in men).
There are group differences in both hematocrit % and red blood cell counts (Lim et al., 2015). It has been found that red blood cell count is extremely heritable, at over 70% (Mahaney et al., 2005). Differences in a trait that is so highly heritable are highly unlikely to be due to environmental factors alone, which has appeared to be a persistent scientific consensus across decades. Given the combination of high heritability and longstanding scientific consensus, it is incredibly difficult to argue against the assertion that differences in prenatal environments are at least partially due to genetics.
Environmental Racism
Another environmental variable that some blame as a unique factor is the environmental racism.
Using county level data from the CDC, I investigated environmental racism.


It seems to be a dubious hypothesis to me, Chief. A lot of these counties without black people are just cornfields in Nebraska that do not have a whole lot of people.
A very small percentage of the variation can be explained by the % African American and the number of African Americans in a county. In fact, this is really just a proxy for environmental regulation and urban areas. I guess in a way, it is unfair that African Americans vote for democrats who want environmental protections and conservative whites stop that. It has been shown that being around African Americans and Hispanics makes whites more conservative.

A map of COPD suggests that it is particularly white areas, aside from Mississippi, that have these issues the most and Latino Areas. Florida, Nevada, Arizona, New Mexico, and a whole lot of white places. I attribute this to smoking, others say it is socioeconomics. Bottom line, the air quality is certainly not bad in Chicago (Cook County) or Detroit (Wayne County) relative to the national averages. To be complaining about sub-par by local standards is absurd. There is not an X-factor of environmental racism.
Economic Data
National development and IQ scores correlate, and we have seen that rises in nominal scores and % of questions correct goes up after economic development. The problem with this is that IQ scores themselves are just a number. What matters is g. The Flynn Effect is not on g. Asserting that national IQ differences are purely caused by socioeconomics is a peculiar thing, but some economists do it (Jones, 2011). We agree that within countries, IQ differences are largely due to genes (shown in Japan’s North-South gradient for sure!). Rindermann and Becker (2018) showed using time lagged data, there is a causal relationship between IQ and economic growth.
One GWAS study (Hill et al., 2016) showed a genetic correlation of 0.69 for the SNP heritability of income and IQ in UK whites. This suggests that the causal force in the heritability of income is intelligence. The question of if non whites are discriminated against on a level to make them more poor than their IQ scores would suggest is answered sufficiently by Charles Murray in “The Bell Curve.”
Head Start and Education Don’t Raise Intelligence
On the theoretical level, I think that the early interventions seem no less useful. I understand the concept of sensitive periods, I guess I am just anti-social science/contrarian but it seems intuitively wrong to me that you can send a kid to pre-k and they get smart. My whole family did pre-k and my brothers are morons.
I have had professors in non-psychology classes that said Head Start raises IQ scores, and this is such a quarter truth. Do shoes make you taller? Like, are the gains on g?
While the media reported IQ gains, few report the fade outs (why should they? Most Americans do not want to read about why intelligence is not malleable — this is part of why the public view of IQ is so messed up, the truth vs. what sells are the opposite!). The initial gains in many programs reported were up to 30 points, however, they faded out — as did the media coverage.
Some argue that there have been successful interventions like the Abecedarian Project that raised IQ’s. They did not control for initial cognitive ability in this program which makes it basically useless. If we are going to take this premise that the mind is a muscle and we can increase power of the brain the same way we can increase the power of the biceps or triceps through training — we must control for the starting point.
If you were testing a protein powder, would you compare the effectiveness of it to build muscle on a group of NBA players and have high school basketball players as the control group? Furthermore, controlling for the Wilson Effect when dealing with fadeout effects cannot be done easily. I would recommend using identical twins for such a project at a bear minimum — in fact, shouldn’t all interventions be tested on MZ twins?
It has also been shown that the IQ gains from these correlate negatively with the subtest g-loadings, so it is highly unlikely that real intelligence gains ever occurred (Nijenhuis et al., 2014).
Studies have suggested that education raises IQ, however, this is misleading. Using IQ as a substitute for intelligence is highly misleading. Regarding the IQ/g-factor distinction, the study most cited for this (Ritchie &Tucker-Drob, 2018) says:
“The vast majority of the studies in our meta-analysis considered specific tests and not a latent g factor, so we could not reliably address this question”
Not only do they acknowledge that they provide no evidence of increasing the g factor, they also show this graph which suggests a considerable fadeout effect.
Lastly, one of the co-authors, Staurt J. Ritchie, wrote a paper on this issue in the past and he did not find good evidence that the gains were all that much to be excited about.
“These results suggest a decoupling of educational gains from increases in general intellectual capacity.” — Ritchie et al., 2015
I have been told that Staurt J. Ritchie is a closeted race realist anyways. He certainly avoided the topic in his book “Intelligence: All That Matters,” but it is a good thing to check out, he is a friendly progressive. The description of his book on google is:
“There is a strange disconnect between the scientific consensus and the public mind on intelligence testing. Just mention IQ testing in polite company, and you’ll sternly be informed that IQ tests don’t measure anything “real”, and only reflect how good you are at doing IQ tests; that they ignore important traits like “emotional intelligence” and “multiple intelligences”; and that those who are interested in IQ testing must be elitists, or maybe something more sinister.”
In conclusion, when talking about race, people who bring up education are either ignorant or using it as a red herring. Satoshi Kanazawa wrote a brief article for the Genetic Literacy Project that compared the Intelligence-Education causalization to people saying that playing basketball makes people taller. Basketball players are tall, highly educated people are highly intelligent. In both cases the latter is the cause of the former.
Proving that g is Caused by Genes
I am well aware that the non-g residuals on IQ tests are real skills and can be improved (mostly short term improvements), but it should be made clear that the underlying factor, g, is almost certainly caused by genes.
Some people do not think that g is a biological property, but the g factor itself is more heritable than the IQ scores themselves, as mentioned earlier. There are biological variables that correlate to the g-loadings of a test, one of them being European admixture in biracial African Americans. The strongest available evidence is that the same g factor exists on a variety of different tests. In one instance, there was a correlation of 0.85 across a bunch of different tests, and the more stable ones were the more g-loaded ones (Thorndike, 1987). More recently, it was shown that in identical twins raised apart, the g factors produced by the CAB, Hawaii, and WAIS tests produced g factors that correlated at 0.99, 0.99, and 1.00 (Johnson et al., 2004).
The question of WHY g exists is a reasonable question. To me, genetics is the strongest answer, but not enough effort has been put into proving that g exists because of genetics.
Lines of Evidence That Could Be Produced
I think that if you look at the 2nd stratum factors of biracial/bi-ethnic kids, they’ll be between the norms. Further investigation should be done.
There is no doubt in my mind that the second stratum factors of transracial adoptees will match their genetic ancestry better than the race of their adopting parents because the IQ scores in these cases match the adopting races.
The way that I would go about proving that g is caused by genetics is to show that the rank order of the standardized scores on the 2nd stratum factors in MZ twins raised apart will be the same more frequently than in DZ twins raised together. Show that cousins raised together are less likely to have the same rank order of 2nd stratum factors than siblings raised apart, etc.
Bias and Racism
Weird White People
There is an entire field of psychology called social psychology, and within that field is studies on bias. It has been shown persistently that white liberals have at least “overcorrected,” their implicit biases. I would argue that it is more of a self hate than a pro-non-white.
Leftists themselves are frequently mentally ill (Kaczynski, 1995; Kirkegaard, 2020). This is not something where it is like me trying to make fun of them — it is actually really sad. Non-whites that perceive large amounts of discrimination and whites that perceive a lot of privilege tend to miss more days for physical and mental health (Fujishiro, 2009).
One study done on college students found that taking courses on diversity increased white guilt (Case, 2007). Another paper, found that whites tend to frame societal inequalities as white advantages as opposed to black disadvantages, but black people tend to do the opposite (Powell et al., 2005).
A Freudian perspective of this might suggest that there is conflict between the conscious (anti racist) and subconscious (race realist) minds. For example, it has been shown that white liberals dumb themselves down when talking to black people (Dupree & Fiske, 2018). It is kind of interesting because university professors frequently communicate with students like they are children, when in reality, many students treat the professors like children. The constant appeasement provided by straight white men who pretend to agree with the professors is kind of disgusting.
It is possible that there is no relationship and there is just a link between religiosity and mental health, but you have to wonder these things. Why is it that college students are always in ill mental health? Is it all that difficult, or is it that they are given an ideology that is unhealthy? The world may never know.


Campus Communism
A supermajority of social scientists in general self ID’d as some variant of communist in the late 2000’s. I do not really see a major difference between radical, activist, and marxist, but that is what they mostly ID’d as in the late 2000’s.

As far as the party ID stuff or the general liberal/conservative dynamic, you are looking at a really big gap. Reminder — a 99:1 ratio= 1% are right wing, 9:1 ratio=10% are right wing, a 4:1 = 20%. You are looking somewhere between 5% and 20% being right wing.
This is not about me saying “oh the psychologists want high taxes” it is about the underlying mental differences between liberals and conservatives. My view of it is “conservatives do not agree with me about all this stuff, but they will not try to ruin my life for my opinions.” Even the progressives that claim to support free discourse do not really — it is one of those performative things where they will change their mind when they start losing the arguments.

A survey of social psychologists found that there is willingness to discriminate against conservatives for jobs and in peer review and many of them know a colleague that would.

Even when a liberal pretends to be all inclusive and open to debate, the farthest you can go is Arthur Jensen or Charles Murray. You cannot start to talk about the life histories perspective (which is the strongest position to debate from and the most backed perspective).
Racism
A barebones definition of racist will be something like “believing one race is superior,” which then gets interpreted as “the belief that race differences exist.” I would be perceived as EXTREMELY racist if people learned I believe that there is a genetic reason for certain demographics having different levels of civilizational achievement. Racism is a flawed on a conceptual level for several reasons, the first being that it requires circular reasoning:
Is it racist to argue against using the word “racist”? Chad and Stacy are arguing. “Let me dismantle the concept of racism,” Chad begins to explain. “No, only racists question the concept of racism” Stacy dismisses. “But ‘racist’ is the very thing in question!” protests Chad. To convince Stacy to examine the concept of racism, Chad would have to convince Stacy that the “racism” of the topic is not justification to be uncritical of the topic. To do this, Chad needs to convince Stacy to examine the concept of racism; the circle is now complete. — Wehrkatzer
Basically what this is saying is that if I provide evidence that racism is flawed as a concept — for example, almost everyone is happier near people of their own race, so forced integration is not a socially optimal policy (this does not mean forced segregation either). Well it would be racist to not be a forced integrationist.
James Flynn noted this sort of circular reasoning about the g-factor theory of intelligence.
“Any evidence that challenges the supremacy of g is not good evidence because it challenges the supremacy of g and that is that.” — Flynn, 2007
Which to his credit, I did not defend the g factor theory of intelligence. The alternative theory of the mutualism has many issues that I am not going to unpack completely, but it is not parsimonious, genetic relatedness correlates with subtest score ratios better than environmental proximity, transracial adoptees have subtest score ratios that match their race more than their adoptive family’s race on average, etc. The mutualism model of human intelligence is bad.
Back to the matter at hand, the power of the term “racist” is that it cannot be objectively defined and people are going to be dehumanized if it is used to describe them… also, it is guilty until proven innocent. Traditionally dehumanized groups are far less dehumanized that “racists” (Heiphetz et al., 2020). Many people will say “I am not racist, but…” before stating a fact because they fear dehumanization. If somebody is accused of being racist, a common response is “No, I am not,” because the only other response is to say “Yes. I am racist.” The proper way to go about it is to ignore it because it does not matter how you respond, they will conclude that you are racist, it is a zero sum game because only a racist would feel the need to say that they are not racist! Robin DiAngelo said so in her book “White Fagility.” What is kind of interesting is that black people persistently say “white people need to read that” and I have tried to talk to black people about that book many times and it seems that none of them read the book.
A system could be racist too because the little amounts of racism that all white people have called implicit bias creates layers and layers of racism.

A meta analysis on various measures of bias showed that white people have a marginally pro-black bias across a bunch of measures. This does not mean that no white people are biased, but what it does mean is that the biases even out. If black people are persistently complaining about how white people judge them so harshly, maybe it is that the norms they are used to give them an extra bump of about 1/3 of a standard deviation and when they are judged fairly, it feels like prejudice because the standards were raised — to an unbiased evaluation.
The operational use of implicit bias tests is not good either. They do not predict racist behavior against out groups, but these measures have not been tested as a predictor of white on white bias. It is likely, to me, that since there is no consequence of prejudice against other white people, the implicit feelings will manifest. For whites with bias against non-whites, there are consequences — these biases do not manifest because the potential punishment prevents discriminatory behavior (on average).
Healthcare Racism
Something that made me really decide that I did not want to do medicine is the idea of medical racism, particularly the topic of race and painkillers because I see too many simpletons give absurd takes about this sort of thing. Which is more probable, the doctors are slower to give certain drugs to blacks than whites because of racism or because different demographics have different frequencies age distributions, prevalence of various conditions that may interact with the drugs, and are using different prescriptions that also may interact with the drug at different rates? Not to mention, African Americans do have a lower tolerance to pain than white Americans, even according to the twatts that accuse doctors of racism (Mossey, 2011). The belief that physicians are just actively ignoring pain is not founded in any sort of reality.
HIV is an area where people are confused. The answer is no, Mike Pence did not ban condoms or any of that. The answer is no, providing access to condoms really does not do a whole lot. That is why the abortion rates are so high in New York City.
A meta analysis of condom interventions showed that there is little, if any, effect on providing condoms (Charania et al., 2011) in America. The 1.41 odds ratio does not reach the effect equivalent of 0.2 cohen’s d units and when ones looking at youth specifically are evaluated, there is not a statistically significant impact. The effect of international studies that were not on female commercial sex workers is also not significantly different from zero.

On meta-meta analysis of the effectiveness of health behavior interventions can be reanalyzed and it shows basically no effect of interventions to reduce HIV (Johnson et al., 2010).
Normies that do not understand the basics of statistics dominate the health behavior “academic research” setting and cannot properly interpret funnel plots (Cugelman et al., 2011; Johnson et al., 1997). The answer is no, the interventions do not work.

The race differences in asthma are often attributed to environmental factors, however, this is incorrect to attribute all of it to the environment. African admixture is a risk factor for asthma (Flores et al., 2012). There are differences in means for forced expiratory volumes as well — these too are not purely environmental (Stanojevic et al., 2013). I will be talking about why this is the case later, but it has to do with type 2 muscles fibers and stuff like that (it actually has something to do with IQ), and it is the consensus that the muscle fibers are different for genetic reasons.
It has been suggested that BMI is a racist metric. I disagree. BMI is a proxy for body fat percentage. Body fat percentage is a proxy for general health. At a given BMI, yes, black people have a lower body fat percentage than whites on average — but that does not matter for the same reason that whites at a given BMI have a lower body fat percentage than East Asians. At a given BMI, racial/ethnic minorities have a higher rate of type 2 diabetes than whites (Zhu et al., 2019).
In post menopausal women, there is a considerable effect of admixture on hypertension — the authors give an odds ratio of 3.06 for African admixture which is equivalent to about 0.6 Cohen’s d units (Kosoy et al., 2012). The question of race and hypertension boils down to “do you believe in history?” and “do you believe in genetics?” because a simple look at a history book will tell you — what did they trade to the Europeans give to the Africans in ancient Mali for gold? SALT! Why did they need salt? Because it is really hot in Africa and you are going to sweat a lot. That is a selective pressure in favor of increased sodium sensitivity and increased sodium retention. Medical schools in the modern day teach “the middle passage hypothesis” however, on a theoretical level, it is improbable that the middle passage would cause selection for sodium sensitivity or sodium retention. Some woke people have said to stop teaching it because it is racist (Lujan & DiCarlo, 2018) — I agree not to teach it because it is stupid. Look at a modern map of hypertension — it is most common in Africa!

Amongst medicare part D beneficiaries aged 65+ in 2014, the rate of anti-hypertensive medication non-compliance appeared as displayed on the map. The non-compliance rate by race was 35.7% for blacks, 33.8% Hispanics, 26.3% for Asian/Pacific Islander, and 24.3% for non-Hispanic white (CDC, 2016). For whatever reason, Hispanics have a shockingly low rate of heart complications and cancers, however, after a couple generations (so like in 2nd and 3rd generation immigrants), these numbers increase and become basically the same as the white population. It should not be a shock that there are worse outcomes if you are looking at a population that is less likely to take medications.
Behavioral differences are profound. The diets of Hispanics changes from first to second to third generation immigrants and it ultimately does look the same as the African American numbers after a couple generations, but at least it is not too bad. Some suggest


African Americans and Hispanics are more likely to be physically inactive and while this may not seem like a big deal — it is not for Hispanics — there is convergence between dietary behaviors and physical activity. In other words, the percentage of the population that drinks a lot of soda, eats fast food often, and does not workout is going to be substantially higher in African Americans than in whites or other demographics. This is not a controversial issue.

Racism in the Justice System
Most of the time that these big names pop up on the TV as racist shootings, it is a lot different than what the public perception is.
For drug crimes, African Americans are more likely to lie about drug use claiming that they used fewer drugs than they did (Page et al. 2009; Falk et al. 1992; Feucht et al., 1994; Fedrich & Johnson, 2005). African Americans are also much more likely to use marijuana outdoors and purchase from strangers (Ramchand et al., 2006).
In America, the cops kill too many people, but it is not on the basis of race. Activist academics that use absurd proxies like the percentage of Americans that are African American should not be t. In 2017, African Americans made up 38% of the violent crime arrests according to the FBI crime tables and about 53% of all homicides.
There is a correlation between local implicit bias and local police shootings against African Americans (Hehman et al. 2017), however, the the implicit bias is a not a predictor of behavior, as mentioned earlier. The question of if the bias is a moderat
Studies have persistently shown the following: (1) The white officers are no more likely to kill non-whites than any other race of officer. (2) When criminality is controlled for, there is not anti-black bias in police shootings (Johnson et al., 2020; Johnson et al. 2019; Schwartz & Lahn, 2020; Streeter, 2019). The strongest point of evidence against racial bias is that black people are 33% of the people killed by non-white cops and only 28% of the people killed by white cops (Meinfeld et al., 2018).
For lawyers, there is a reciprocal call back bias. White lawyers like white names, black lawyers like black names. The call back biases are relatively small, however (Libgober, 2019).
In pre-trial outcomes, there has been a reported 9% higher probability that an African American is charged (Wu, 2016). This paper includes 36 studies and 11 studies that did not report standard errors. When those are excluded, there is no statistically significant effect of race. There is also a low IQ as a risk factor for false confessions (Schatz, 2018).
For judges, there is not a lot of data, however, in the early 1990’s there was no effect of race in sentencing in Pennsylvania (Steffenmeier & Britt, 2001). In the period from 1968 to 1974, there was “bias” against blacks that was from both black and white judges (Ulhman, 1978). I say “bias” because if it is coming from both black and white judges to the same degree, you have to question if it is racially motivated. I would say that the answer is probably not.
When it comes to jury bias, it is unlikely an issue. There is major in group bias by black jurors and less than a 0.05 standard deviation effect size for white jurors (Mitchell et al., 2005). A more recent study found a mild bias against Hispanics from whites, but not an anti-black bias (Devine & Caughlin, 2014).
Racism in the Education System
School funding is a net transfer of money across racial lines. To call it systemically racist would require proof that your demographic pays in more than it takes out. I am not kidding — you are not entitled to other people’s money, but let us pretend that you are and I grant the premise that non-white schools are underfunded (this is not the case, but it does not matter). The two issues are school funding and class sizes, how do they influence educational outcomes?
Class sizes have been shown to be a non-issue to begin with (Schanzenbach, 2014; Filges et al., 2018; Johnson, 2000). This is one of those things where the public perception is completely out of line with the data, but there is not solid evidence to suggest that kids will get smarter if the classes get smaller.
School funding is not a particularly important variable in determining test scores. Tests are the best way to do things because they are standardized. There is variance in standards from state to state for mastery of skills to graduate, so the standardize tests are the most objective way to measure performance.
School funding to begin with is a dubious measure of fairness in a sense that it has not been a major factor in improvement of standardized test scores (Haertel, 2013). Obviously, the tests get renormed and made easier, but the “gains” are not attributable to the the school factors — as to how much of the school factors+teachers effect is attributable to the money, it is unknown.

If you look at the NAEP scores by state and the per pupil spending by state, there is basically no correlation in the time lagged data.


Is school staff racist? African American students and white students are equally likely to be suspended after being sent to the principal’s office (Skiba et al., 2002). The authors interpreted this as evidence that perhaps the teachers are racist because these behavioral differences persist in net of socioeconomic status. This seems unlikely. African American kids are just as likely to get suspended as white kids with the same number of behavioral problems (Wright et al., 2014).
In conclusion, the question is not “have African Americnas been mistreated on the basis of race?” but the question is, “Does the median person overestimate or underestimate the degree to which black people have been mistreated?” I think that there is sufficient evidence to suggest that the answer is “overestimate.” Having a level headed view on the historical race relations that is based on facts as opposed to narratives is important to making any proper judgement.
Addressing Revisionist History
Many “hate facts” are attributed to “historical oppression” however, this is not a claim that cannot be contested. The presupposition that nobody has a different perspective of how history happened is one that ideologues maintain, but I am happy to provide legitimate arguments against “history.” The Nazis had their trial and were found guilty — what about white Americans? At no point were white Americans ever found guilty of many allegations being made, and I would like to present evidence to the contrary of common beliefs. It seems, to me, that an all too common misunderstanding of American history is that the focal point of whites’ existence has been to abuse blacks (see Tariq Nasheed talking to Jared Taylor on YouTube). Many things can be true at once (1) Americans have historically hated black people. (2) Americans mistreated blacks on the basis of race. (3) The historical effects of this all are negligible.
I am not under the impression that nothing wrong was ever done (well aware of the double negative), but a lot of context is needed. The three points of contention are that Africa is not poor because of colonialism, slavery was neither a source of wealth for America, nor as brutal as frequently portrayed, segregation was not nearly as bad as most claim, and over the recent decades, America has seen increased gaps that validate this (unless you wish to blame the IQ scores and the increased dependence on intelligence).
A explanation for Africa and its economic failures is that colonialism made them poor. Weren’t they poor before colonialism? I have read Guns, Germs, and Steel… I will just be providing positive evidence instead of going over everything wrong in the book. Countries that were colonized have higher incomes than those that were not — in fact a century of colonization is linked (by correlation) with an increase in incomes by 40%, and more recent colonization is more helpful. Infant mortality is also higher in places that were colonized to a lesser degree (Feyrer & Sacerdote, 2006).
As far as slavery making America rich, no. Brazil had slaves long after the United States, England got rid of them first. Put those three countries in rank order of industrialization (it is the reverse). From 1675 to 1774, the income per capita of Southern colonies fell by ~15%, but it did not fall in the Middle Colonies, and increased in the New England Colonies. From 1800 to 1860, the rate of economic growth in New England outpaced the Mid Atlantic colonies, which outpaced the Southern Colonies (Lindert & Williamson, 2016). The value of farmland in 1860 tended to be lower in the areas that fought in the confederacy (Lindert, 1988). This is odd, you would think that having the so called cash crop of cotton and free labor would actually increase the value of land, as it would have greater economic potential, why is that? The robustness of the use of slaves being negatively linked to future economic prosperity has generated speculated that it is related to IQ (Osongu & Kodila-Tedika, 2015).
On the practical level, if you own a lot of slaves and do not treat them right, you have to pay people to watch them to prevent them from running away and you need a sufficient number of people watching them to prevent a rebellion. If you recall from grade school, the guns used in the civil war were single shot. If you had 400 slaves and 40 people watching them with guns, a rebellion would work. When you own slaves, you cannot let them die, they have to be housed and fed. It has been argued that a supermajority of slaves were said to be owned by owners that had fewer than 20 slaves. These owners were able to keep constant contact+received humane treatment (Farley, 1965). Also, the life expectancy of African Americans in the decades prior to the civil war was higher than during the decades following the civil war (Vinovkis, 1975). The ethics of slavery are wrong on their face, but in terms of pain inflicted, I think that it is very hard to argue that it was greater than what it would have been in Africa (where they would have also been slaves).
Black-White Disparities During Jim Crow vs. Today
It is widely uncontroversial that the racial gap in home ownership was smaller during Jim Crow than it is today. It is so uncontroversial that even Zillow is willing to acknowledge it.

The gaps in unemployment prior to the 1920’s were smaller than during Trump’s presidency where he paraded around about the black unemployment. The gap in black and white unemployment was smaller in 1960 than in 2013 as well. (Fairley & Sundstom, 1997; Pew 2013).


When people like Donald Trump boast “the black unemployment rate is at an all time low,” they are omitting that the gap in prime-age male workforce participation grew strikingly from 1971 to the 2010’s (Whitehouse Council of Economic Advisors, 2016). Do more black men have jobs or are the ones that can’t get them just giving up?
In the 21st century, allegations of systemic racism and prejudice juries are unfounded, in fact, as early as the 19th century, there was a pro-black bias in the legal system in Pennsylvania (Bodenhorn, 2008). Do these people think that Americans are more racist now than it was during the 19th century?
Allegations of banking discrimination are largely revisionist. In the modern day, it is said that non-whites (except East Asians of course) have to pay more for home loans because of racism. Two members from the board of the federal reserve examined this, and the answer is no (Bhutta & Hizmo, 2019). The belief that “redlining” was a unitary policy and not part of a larger regulatory procedure is incorrect. The HOLC (Home Owners’ Loan Corporation) actually caused more damage in some of the neighborhoods that were not “redlined” in many cases (Aaronson et al., 2017). If you think that there was racial discrimination against African Americans, please explain to me why the people most negatively impacted by this policy were not African American.
Why is it that many studies find discrimination? Well, part of it is that they operate on the assumption of the credit scores being measurement invariant. When you give a loan to a black person with a credit score — they are less likely to repay the loan than a white person with the same credit score. A lot of people do not like to hear it, but this is an uncontroversial fact: “Consistently, across all three credit scores and all five performance measures, blacks… show consistently higher incidences of bad performance than would be predicted by the credit scores.” (Federal Reserve Board, 2007) Why is this? Well, one reason is that the savings behavior of blacks when adjusted for income, age, family size, education, and marital status is not as long term oriented as whites (Borgo, 2013).
If there was discrimination in the loans (meaning a higher standard for black borrowers than white borrowers), why is it that they did not have a higher rate of defaulting on their loans (Berkovec et al., 1994). Moreover, it was found that black owned banks were more discriminatory than white owned banks (Black et al., 1997) which is odd.